Zinger Key Points
- Ethereum is trading above the eight-day and 21-day exponential moving averages, the eight-day EMA trending above the 21-day, both of which are bullish indicators.
- Ethereum Classic’s relative strength index is registering in at over 80%. Eventually, the crypto will enter into a longer period of consolidation to cool the oscillator.
- Don't face extreme market conditions unprepared. Get the professional edge with Benzinga Pro's exclusive alerts, news advantage, and volatility tools at 60% off today.
Ethereum ETH/USD and Ethereum Classic ETC/USD were flying up over 12% and 4%, respectively, on Tuesday. The cryptocurrency sector has been rebounding since March 14, with Ethereum Classic leading the way and skyrocketing over 70% since that date.
The cryptocurrency market has been put to the test over the past month, following Russia’s invasion of Ukraine and an escalating humanitarian crisis in Europe, as traders and investors place their bets on whether cryptos will perform as safe haven assets. Traditionally, during times of war and broader geopolitical uncertainty, commodities such as gold have shown strength.
Technically speaking, Ethereum and Ethereum Classic were set to trade higher because of the bullish signals the two cryptos had flashed on their charts. On Tuesday, Ethereum was breaking up from a bull flag pattern on its daily chart that Benzinga called out on Monday, while Ethereum Classic was continuing its massive ascent north after printing a bullish quadruple bottom pattern, which Benzinga pointed out on March 15.
The two cryptos look set to fly even higher, although Ethereum Classic will eventually need to enter into a longer period of consolidation, whereas Ethereum has room to make an imminent run.
However, it should be noted that events affecting the general markets and negative or positive reactions to news headlines can quickly invalidate patterns and breakouts. As the saying goes, "the trend is your friend until it isn't" and any trader in a position should have a clear stop set in place and manage their risk versus reward.
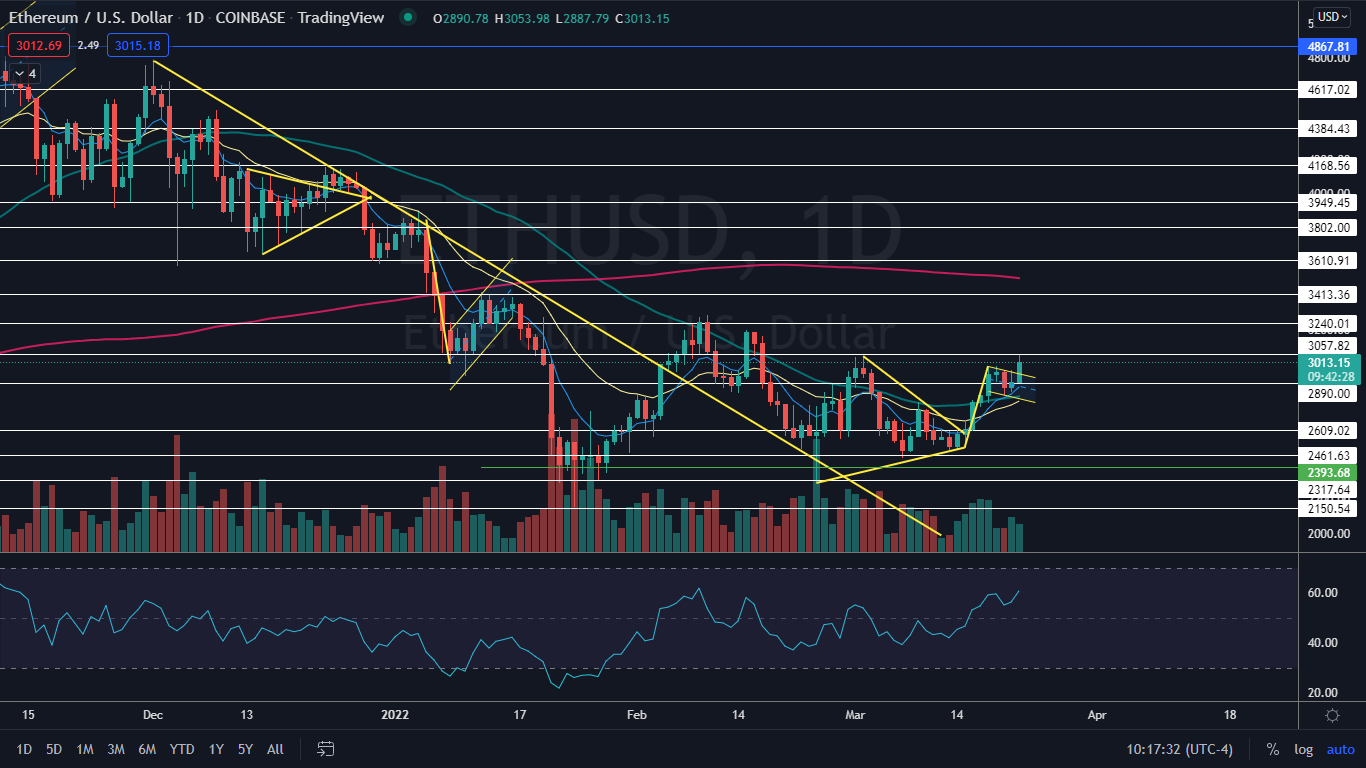
The Ethereum Chart: Between March 15 and March 18, Ethereum created the pole of a bull flag pattern and settled into the flag on the three days that followed. The measured move, that is calculated by adding the length of the pole as a percentage to the bottom of the flag, is about 20%, which indicates the crypto could soar up toward the $3,400 level.
- Sunday’s price action, which fell to the lowest price within the flag, also marks the most recent consecutive higher low in Ethereum’s uptrend, while Tuesday’s price action has created a higher high. Eventually the crypto will need to print another higher low above the $2,819 level, which could offer bullish traders who are not already in a position a solid entry.
- Ethereum is trading above the eight-day and 21-day exponential moving averages (EMAs), with the eight-day EMA trending above the 21-day, both of which are bullish indicators. If Ethereum is able to spike up over the $3,400 level, it will regain support at the 200-day simple moving average (SMA), which would confirm a bull market is on the horizon.
- Ethereum has resistance above at $3,057 and $3,240 and support below at $2,890 and $2,609.
Want direct analysis? Find me in the BZ Pro lounge! Click here for a free trial.

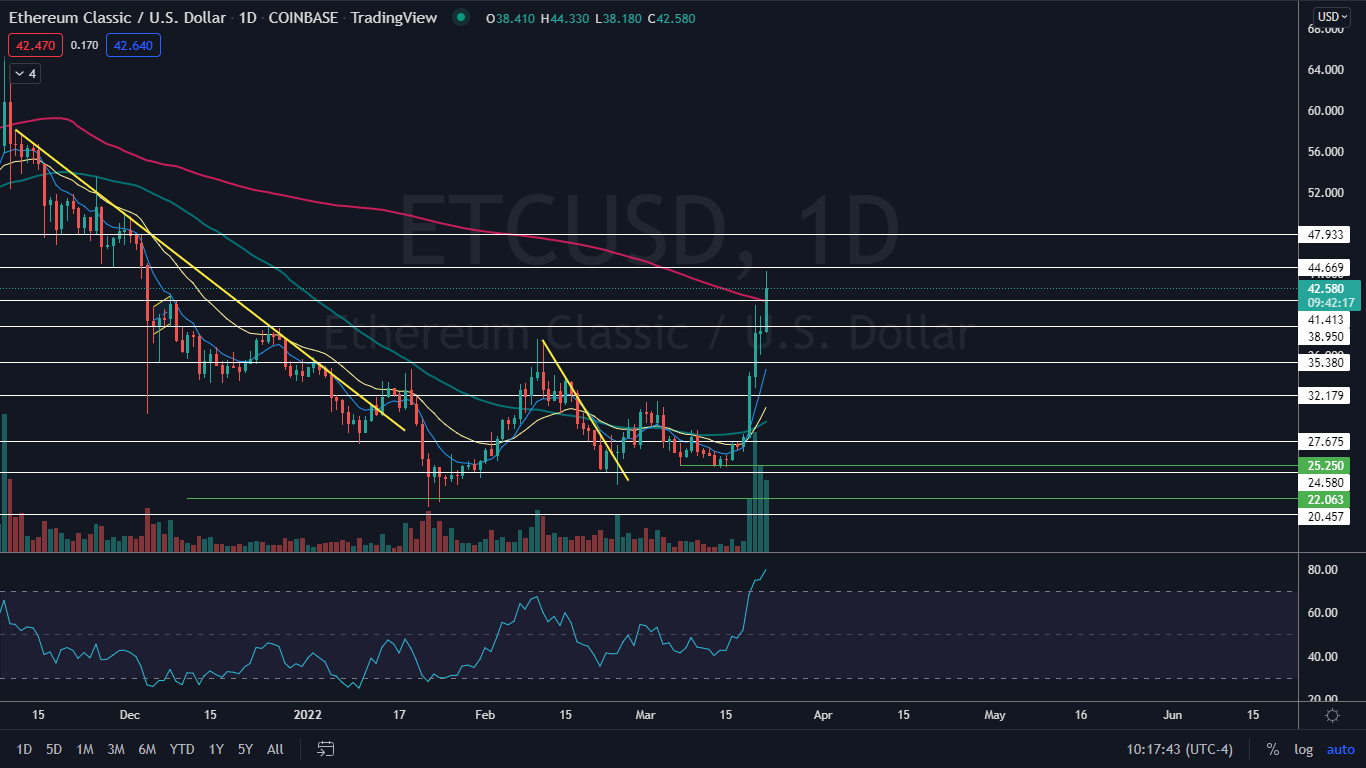
The Ethereum Classic Chart: On Monday, Ethereum Classic printed a bullish inside bar pattern in consolidation, which Benzinga pointed out may happen on Sunday. The inside bar allowed for the eight-day EMA to catch up slightly, although the crypto is still technically over-extended. On Tuesday, Ethereum Classic was breaking up bullishly from the inside bar pattern, which was the most likely scenario.
- The upward break from the pattern caused Ethereum Classic to regain support at the 200-day SMA. If the crypto can remain above the level, the 50-day SMA will eventually cross above the 200-day, which would cause a bullish golden cross.
- As well as being extended from the EMAs, Ethereum Classic’s relative strength index is registering in at over 80%. Eventually the crypto will run into profit takers and enter into a longer period of consolidation to cool the oscillator and allow the EMAs to catch up.
- When the pullback takes place, traders and investors who are not already in a position can watch for an entry on the higher low, which could be signaled with a reversal candlestick such as a doji or hammer.
- Ethereum Classic has resistance above at $44.66 and $47.93 and support below at $41.41 and $38.95.

Edge Rankings
Price Trend
© 2025 Benzinga.com. Benzinga does not provide investment advice. All rights reserved.
Trade confidently with insights and alerts from analyst ratings, free reports and breaking news that affects the stocks you care about.