Zinger Key Points
- The stock is likely to find heavy resistance at the 200-day simple moving average, which is currently trending just below the $16 level.
- There is a gap below on Jumia’s chart between $9.94 and $10.38, which is about 90% likely to fill in the future.
- Feel unsure about the market’s next move? Copy trade alerts from Matt Maley—a Wall Street veteran who consistently finds profits in volatile markets. Claim your 7-day free trial now.
Jumia Technologies AG JMIA was skyrocketing up over 27% higher on Monday after the Africa-based e-commerce company announced it will expand its logistics services on the continent through a new partnership with United Parcel Service, Inc UPS.
The announcement added a high level of momentum to the uptrend Jumia reversed into on March 15, after a 90% decline, which brought the stock down from its Feb. 10, 2021 all-time high of $69.89 to a low of $6.41.
In the uptrend, the higher highs indicate the bulls are in control, while the intermittent higher lows indicate consolidation periods. Traders can use moving averages to help identify an uptrend, with rising lower timeframe moving averages (such as the eight-day or 21-day exponential moving averages) indicating the stock is in a steep shorter-term uptrend and rising longer-term moving averages (such as the 200-day simple moving average) indicating a long-term uptrend.
A stock often signals when the higher high is in by printing a reversal candlestick such as a doji, bearish engulfing or hanging man candlestick. Likewise, the higher low could be signaled when a doji, morning star or hammer candlestick is printed. Moreover, the higher highs and higher lows often take place at resistance and support levels.
In an uptrend the "trend is your friend" until it’s not, and in an uptrend there are ways for both bullish and bearish traders to participate in the stock:
- Bullish traders who are already holding a position in a stock can feel confident the uptrend will continue unless the stock makes a lower low. Traders looking to take a position in a stock trading in an uptrend can usually find the safest entry on the higher low.
- Bearish traders can enter the trade on the higher high and exit on the pullback. These traders can also enter when the uptrend breaks and the stock makes a lower low, indicating a reversal into a downtrend may be in the cards.
See Also: Jumia Clocks 26% Revenue Growth In Q4
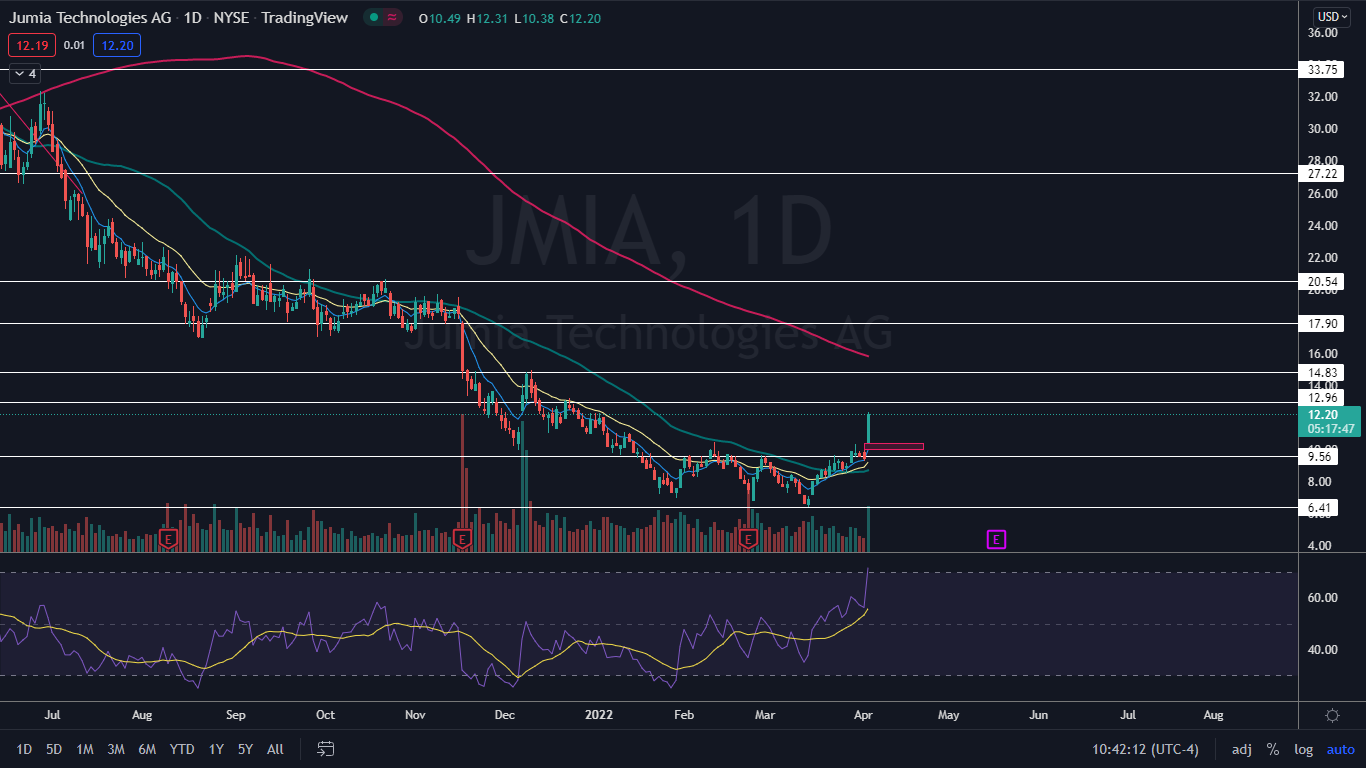
The Jumia Chart: On March 14 and March 15, Jumia printed a bullish double bottom pattern near the $6.40 level, which prompted a reversal into an uptrend. The stock’s most recent lower high was printed on Friday and the $9.30 level and the higher high, above the most recent March 30 high of $10.35, was printing on Monday.
- If Jumia closes the trading day near it’s high-of-day, the stock will print a bullish kicker candlestick, which could indicate higher prices will come again on Tuesday. If higher prices don’t come, the second most likely scenario is that Jumia will print an inside bar pattern to begin consolidating Monday’s move higher, which would lean bullish.
- Eventually, Jumia will trade lower to print another higher low, which may give bullish trader who are not already in a position a solid entry.
- If the stock continues to trade higher over the coming days, bearish traders looking to enter a short position and bullish traders looking to book profits can watch for a volume climax to take place as bullish traders become exhausted. The stock is likely to find heavy resistance at the 200-day simple moving average, which is currently trending just below the $16 level.
- There is a gap below on Jumia’s chart between $9.94 and $10.38, which is about 90% likely to fill in the future. The gap is above the most recent higher low, and if Jumia trades down to fill the area over the coming days, the uptrend will remain intact as long as it bounces from the area.
- Jumia has resistance above at $12.96 and $14.83 and support below at $9.56 and $6.41.
Want direct analysis? Find me in the BZ Pro lounge! Click here for a free trial.
Edge Rankings
Price Trend
© 2025 Benzinga.com. Benzinga does not provide investment advice. All rights reserved.
Trade confidently with insights and alerts from analyst ratings, free reports and breaking news that affects the stocks you care about.