Zinger Key Points
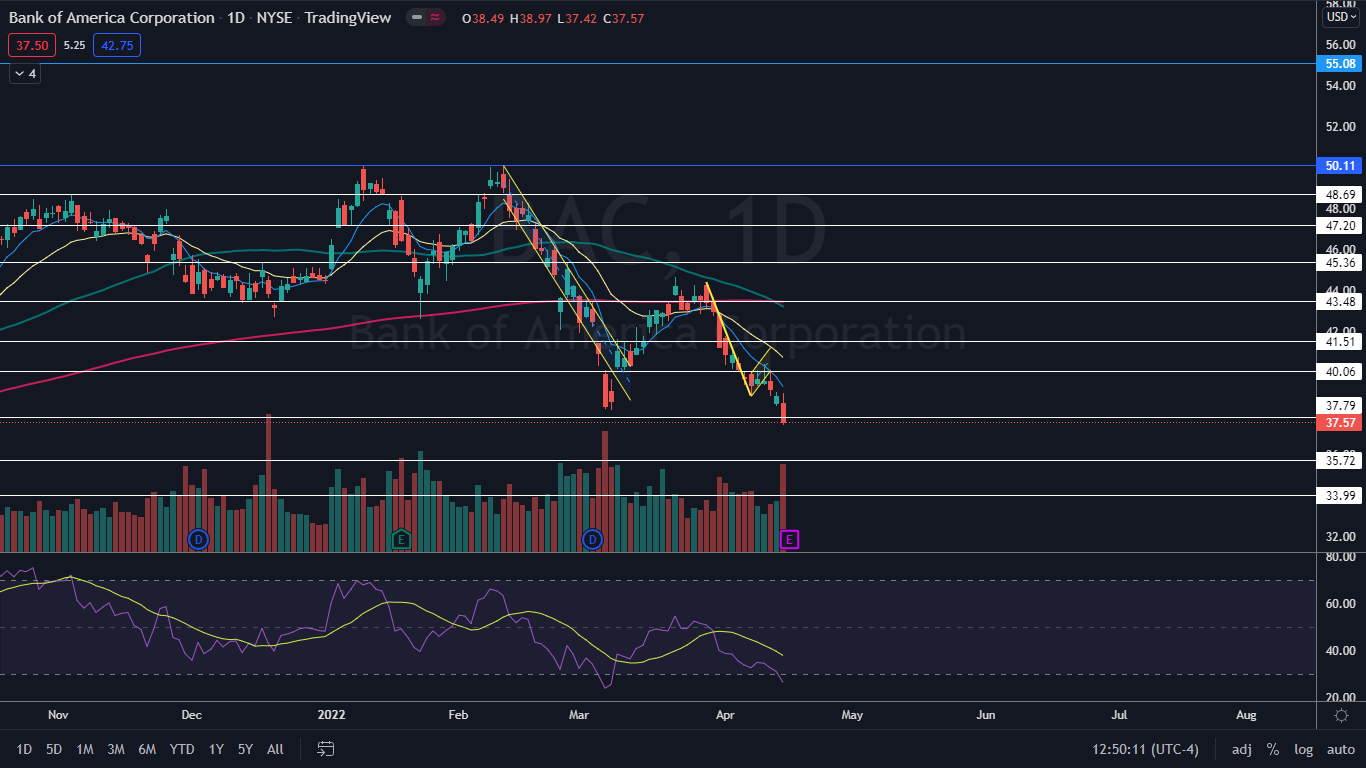
- Bank of America developed a bear flag on the chart between March 29 and April 11.
- The stock's relative strength index is at about 26%, which indicates a bounce may be coming.
- Feel unsure about the market’s next move? Copy trade alerts from Matt Maley—a Wall Street veteran who consistently finds profits in volatile markets. Claim your 7-day free trial now.
Bank of America Corporation BAC closed the trading session on Friday down 3.22%, as the stock continued its decline after breaking bearishly from a bear flag pattern on April 12.
On Monday morning, before the market opens, Bank of America is set to print its second-quarter earnings results. When the bank reported its first-quarter earnings on Jan. 19, the stock gapped up 4.6% to start the trading before declining over 4% intraday and continuing to fall an additional 8.3% over the three trading days that followed.
Bank of America is now trading down at a level not seen since Aug. 2, 2021 and traders and investors will be watching closely as to how the stock reacts to its earnings print because there are mixed signals developing on the daily chart.
With the stock so heavily beaten down, an earnings beat or positive guidance from the company could potentially have a very bullish reaction for the stock. Of course, holding a stock or options through earnings is akin to gambling because a stock can fall on a positive print and soar on negative results.
Want direct analysis? Find me in the BZ Pro lounge! Click here for a free trial.
The Bank of America Chart: In its recent descent, Bank of America developed a bear flag between March 29 and April 11, with the pole formed between March 29 and April 7 and the flag formed over the two trading days that followed. The measured move on the break of the bear flag is about 12%, which indicates the stock could fall toward the $35 level.
- Bank of American has currently completed about 7% of the measured move, and if the stock suffers a bearish reaction to its earnings, Bank of America may bounce once it falls the additional $2.50 to reach the target.
- On Friday, Bank of America printed a large inverted hammer candlestick, which when found in a downtrend can indicate a reversal to the upside is in the cards. Bank of America could also print an inside bar pattern on Monday to consolidate the move lower, especially if the earnings reaction is neutral.
- Bank of America’s relative strength index (RSI) is measuring in at about 26%, which indicates at least a bounce may come over the next few trading days. When a stock’s RSI reaches or falls below the 30% level, it becomes oversold, which can be a buy signal for technical traders.
- On Friday, Bank of America had higher-than-average bearish volume, which indicates a high level of bear interest and fear from the bulls. The volume will eventually lessen as the stock runs out of sellers, which could also provide a bounce opportunity.
- Bank of America has resistance above at $37.79 and $40.06 and support below at $35.72 and $33.99.

Photo: Courtesy of Mike Mozart on Flickr
Edge Rankings
Price Trend
© 2025 Benzinga.com. Benzinga does not provide investment advice. All rights reserved.
Trade confidently with insights and alerts from analyst ratings, free reports and breaking news that affects the stocks you care about.