Zinger Key Points
- On Wednesday, Dogecoin regained support at the eight-day exponential moving average.
- Dogecoin's RSI is currently just under the 50% level, with plenty of room to move in either direction.
- Get 5 stock picks identified before their biggest breakouts, identified by the same system that spotted Insmed, Sprouts, and Uber before their 20%+ gains.
Dogecoin DOGE/USD popped up over 4% higher on Wednesday, in tandem with Bitcoin BTC/USD and Ethereum ETH/USD, which were trading over 5% and 6% higher, respectively.
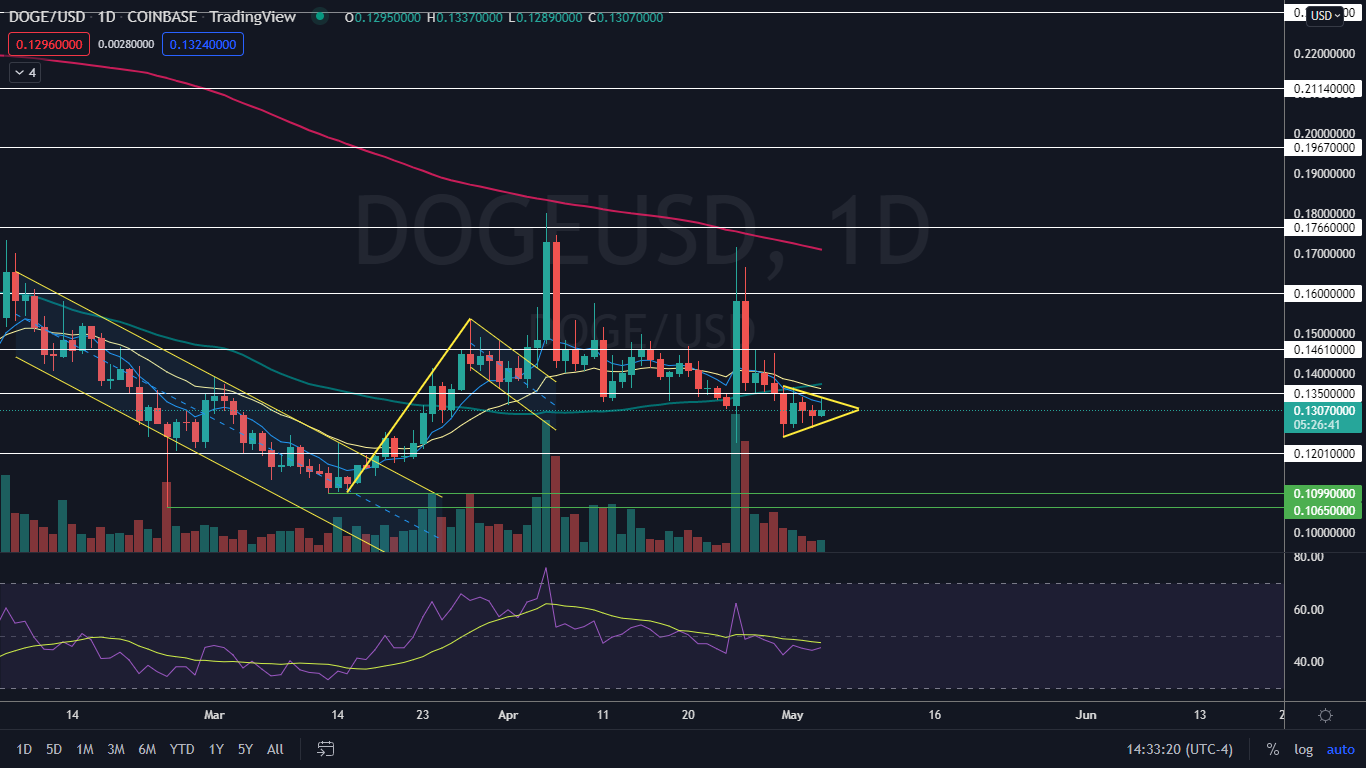
The crypto had been trading into a tightening range within a triangle pattern after plunging over 25% between April 26 and April 30, which settled Dogecoin into a bear flag pattern on the daily chart but the surge following the Federal Reserve's decision to raise interest rates by .5bps as opposed to .75 bps set the markets on fire.
Dogecoin may be reversing into an uptrend, which would bring much relief to the retail traders who closely follow the crypto.
An uptrend occurs when a stock consistently makes a series of higher highs and higher lows on the chart.
The higher highs indicate the bulls are in control, while the intermittent higher lows indicate consolidation periods.
Traders can use moving averages to help identify an uptrend, with rising lower timeframe moving averages (such as the eight-day or 21-day exponential moving averages) indicating the stock is in a steep shorter-term uptrend and rising longer-term moving averages (such as the 200-day simple moving average) indicating a long-term uptrend.
A stock often signals when the higher high is in by printing a reversal candlestick such as a doji, bearish engulfing or hanging man candlestick. Likewise, the higher low could be signaled when a doji, morning star or hammer candlestick is printed. Moreover, the higher highs and higher lows often take place at resistance and support levels.
In an uptrend the "trend is your friend" until it’s not, and in an uptrend there are ways for both bullish and bearish traders to participate in the stock:
- Bullish traders who are already holding a position in a stock can feel confident the uptrend will continue unless the stock makes a lower low. Traders looking to take a position in a stock trading in an uptrend can usually find the safest entry on the higher low.
- Bearish traders can enter the trade on the higher high and exit on the pullback. These traders can also enter when the uptrend breaks and the stock or crypto makes a lower low, indicating a reversal into a downtrend may be in the cards.
Want direct analysis? Find me in the BZ Pro lounge! Click here for a free trial.
The Dogecoin Chart: On Wednesday, Dogecoin broke up from the flag formation to negate the pattern and regained support at the eight-day exponential moving average. If Dogecoin is able to surge up above the April 30 and May 1 high-of-day at the $0.136 mark, and uptrend will confirm because Dogecoin already printed a higher low at the $0.126 mark on Tuesday.
- Dogecoin’s volume had been steadily decreasing, which indicated both consolidation and a lack of interest from both the bulls and the bears. Decreasing volume is often followed by a surge in volume, which helped to break the crypto from the pattern. At press time, Dogecoin’s volume was measuring in at about 124 million on Coinbase, compared to the 10-day average of 424.8 million.
- Dogecoin’s relative strength index (RSI) has been trending slightly higher over the past few days, which leans bullish. The RSI is currently measuring in just under the 50% level, which means Dogecoin has plenty of room to move in either direction before becoming overbought or oversold.
- Dogecoin has resistance above at $0.135 and $0.146 and support below near the 12-cent and 10-cent levels.

See Also: Much Wow: Largest Commercial Dogecoin Transaction Ever Buys BIG3 Basketball Team
© 2025 Benzinga.com. Benzinga does not provide investment advice. All rights reserved.
Trade confidently with insights and alerts from analyst ratings, free reports and breaking news that affects the stocks you care about.