Year 3, Week 40 Major Position Changes
To see historic weekly fund changes click here OR the label at the bottom of this entry entitled 'fund
positions'.
Cash: 85.9% (v 68.2% last week)
15 long bias: 10.7% (v 24.5% last week)
2 short bias: 3.4% (v 7.0% last week) [Includes 1 'long dollar' position]
17 positions (vs 20 last week)
Weekly thoughts
After months of "hear no evil, see no evil" the market finally faced the music. And how. Monday was the strangest day of the week as we had a rally on a well known Greek bailout that was telegraphed to the market. Of course futures were juiced premarket as any good Monday should be. Well it *was* Monday and that is the day of the week we have a 80% chance of winning. At least the past 8 months (is it 9 yet?). The rest of the week was down, down, down (yow!), and down Tue-Fri. Thursday May 6th will go down as one of the most remarkable days in history. But not to worry - in good American reactionary fashion (rather than pre-emptive) people have now woken up to the case that there might be a "teeny" issue when 60-70% of your volume is computers daytrading in milliseconds to each other under the guise of "liquidity". You see, this financial 'innovation' works great at providing liquidity - except when its needed. Oh as for that fat finger lie?
Either way, Thursday's action creates some head scratching for chart watching. While the first 3.5-4% was "real" what do we make of that last 5-6%? The one thing that crazy 30 minutes did do was fill the gaps we mentioned just Wednesday morning! [Minding the Index Gaps] Now in my minds eye those gaps were going to fill in a manner of weeks (3-6), not 24 hours later. Traditionally we'd look for an eventual retest of the lows before going back up, but *what* were the lows? I don't know what counts and does not count. What we did see Friday was in a nasty volatile session a retest of the 200 day moving average.
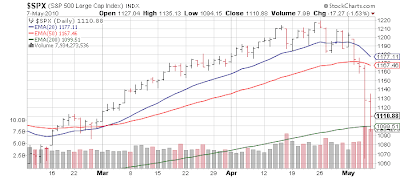
And with the shock and awe campaign unleashed in Europe Sunday (I originally read to be $800B but now close to $1 Trillion) we should see a 2.5-3% move up right quick, which will take the S&P from 1110 to 1140ish. And "free market capitalists" (i.e. market speculators) everywhere will clap at yet another intervention in what has now become commonplace since 2008.
Obviously we are now in about a 65 point window in the S&P 500... the bottom being the 200 day moving average of 1100 and the top being the (turning downward) 50 day moving average of 1167... that should be roughly 1165 by end of day today/tomorrow. Within this band it's fine to trade but building up long term positions with any confidence will be tougher.
It was also rumored that the "nuclear option" of the European Central Bank to turn BOJ (Japan), BOE (England), and Fed (USA! USA!) and buy government debt would be the last chess move. And this too has been announced in late breaking news Sunday.

Since none of this debt has been dealt with and just goes into hiding places on central banker balance sheets, we've once again done nothing but kick the can. But at least the Eurozone can join its ugly 3 brothers in playing the game as the rules were rewritten overnight on what their central bank can do. Truly groundbreaking events circa so much of what we saw in 2008.
So if the pattern repeats of what happened in the U.S. the world should go on a new rally to new (nominal) highs as fiat currency is printed and shoveled into the system at every orifice, and the "liquidity rally" can ensue. By the way American taxpayer - you are funding the bailout of European banks (which really is what this is at the heart of it all) via your majority funding of IMF. Thank you ... again.
--------------------------------
A quick word on some economic data which was overshadowed last week. There are two employment reports each month but the more widely followed one (which most likely is less accurate at turning points) signaled 290,000 job gains. Ex census workers 224,000. But ex the magical "birth death model" (which creates jobs out of thin air from businesses too small to measure) it was about 36,000 jobs. Yes folks 188,000 birth death model jobs. Maybe in reality small businesses (lacking credit) added 300,000... or 500,000... or 0. I certainly don't know. I am simply pointing out how much of the good news was either census workers or made up numbers...
This week, it is very quiet actually on the economic front. Bernanke apparently speaks twice - Monday & Thursday... if the Fed every raises rates again (don't laugh) it will be forecast to markets in speech first. I see no chance of this anytime soon. Lots of bond auctions but other than that nothing too earth shattering until Friday's retail report, industrial production and consumer sentiment.
----------------------------------
As for the portfolio, I am happy with the process last week - the only thing I screwed up were shorter term index trades. In terms of core position, one after the other popped out as it broke support (mostly the 50 day moving averages) so when the flush out happened, aside from a handful of positions we were already "out" having moved down from 44% long exposure 2 weeks ago to under 14% when the flush happened. Another 1.5% fell off the table in the huge swoosh down Thursday. I was duped by the Monday surge and had index positions in the wrong direction when Greece begin to "matter" yet again (despite the previous Sunday's bailout) Tuesday. So I took a loss that day. But a late to the game Thursday put position helped save the week - even with what I consider a poor entry point and an exit point nowhere near the lows it still pushed the portfolio to a positive for a very ugly day in the markets, and helped to make up some of the losses earlier in the week. In total portfolio value was net higher this Friday then the previous Friday protecting investors from a huge downfall in the market this week. But of course with protection (insurance) comes inability to benefit from an oversold bounce so we'll be lagging Monday morning very badly. But no real short positions are on except short bonds and long US dollar, and they are relatively minor so we won't be hurt much.
For the week on the long side:
Unfortunately we have a lot of broken charts on the long side, and the gap up Monday is going to simply create reversals with new gaps that need to be filled in most names. One thing to keep an eye on is how these charts act once the stocks do their dead cat bounces into support they broke last week.


Market News and Data brought to you by Benzinga APIsTo see historic weekly fund changes click here OR the label at the bottom of this entry entitled '
Cash: 85.9% (v 68.2% last week)
15 long bias: 10.7% (v 24.5% last week)
2 short bias: 3.4% (v 7.0% last week) [Includes 1 'long dollar' position]
17 positions (vs 20 last week)
Weekly thoughts
After months of "hear no evil, see no evil" the market finally faced the music. And how. Monday was the strangest day of the week as we had a rally on a well known Greek bailout that was telegraphed to the market. Of course futures were juiced premarket as any good Monday should be. Well it *was* Monday and that is the day of the week we have a 80% chance of winning. At least the past 8 months (is it 9 yet?). The rest of the week was down, down, down (yow!), and down Tue-Fri. Thursday May 6th will go down as one of the most remarkable days in history. But not to worry - in good American reactionary fashion (rather than pre-emptive) people have now woken up to the case that there might be a "teeny" issue when 60-70% of your volume is computers daytrading in milliseconds to each other under the guise of "liquidity". You see, this financial 'innovation' works great at providing liquidity - except when its needed. Oh as for that fat finger lie?
- Regulators now believe the disruption was caused by a toxic, not-yet-understood, feedback loop created when multiple trading schemes interacted, according to people familiar with the situation. That contradicts earlier speculation that the trigger was a small number of erroneous trades.
Either way, Thursday's action creates some head scratching for chart watching. While the first 3.5-4% was "real" what do we make of that last 5-6%? The one thing that crazy 30 minutes did do was fill the gaps we mentioned just Wednesday morning! [Minding the Index Gaps] Now in my minds eye those gaps were going to fill in a manner of weeks (3-6), not 24 hours later. Traditionally we'd look for an eventual retest of the lows before going back up, but *what* were the lows? I don't know what counts and does not count. What we did see Friday was in a nasty volatile session a retest of the 200 day moving average.

And with the shock and awe campaign unleashed in Europe Sunday (I originally read to be $800B but now close to $1 Trillion) we should see a 2.5-3% move up right quick, which will take the S&P from 1110 to 1140ish. And "free market capitalists" (i.e. market speculators) everywhere will clap at yet another intervention in what has now become commonplace since 2008.
Obviously we are now in about a 65 point window in the S&P 500... the bottom being the 200 day moving average of 1100 and the top being the (turning downward) 50 day moving average of 1167... that should be roughly 1165 by end of day today/tomorrow. Within this band it's fine to trade but building up long term positions with any confidence will be tougher.
It was also rumored that the "nuclear option" of the European Central Bank to turn BOJ (Japan), BOE (England), and Fed (USA! USA!) and buy government debt would be the last chess move. And this too has been announced in late breaking news Sunday.
- The European Central Bank said it will buy government and private bonds as part of an historic bid to stave off a sovereign-debt crisis that threatens to destroy the euro.
- The central bank said it will intervene in “those market segments which are dysfunctional,” signaling it views the recent surge in some of the region’s bond yields as unjustified.
- While the ECB cannot buy bonds directly from governments, the euro’s founding treaty doesn’t ban it from doing so in the secondary market, providing the bank with some room to execute today’s plan. The bank’s council will decide the scope of the intervention.
- The concern is that the purchasing of government debt opens the ECB to the accusation it’s helping authorities plug holes in their budgets, raising questions about its independence. An unchecked increase in the amount of money in circulation could also fan inflation, the containment of which is the ECB’s main aim.

Since none of this debt has been dealt with and just goes into hiding places on central banker balance sheets, we've once again done nothing but kick the can. But at least the Eurozone can join its ugly 3 brothers in playing the game as the rules were rewritten overnight on what their central bank can do. Truly groundbreaking events circa so much of what we saw in 2008.
So if the pattern repeats of what happened in the U.S. the world should go on a new rally to new (nominal) highs as fiat currency is printed and shoveled into the system at every orifice, and the "liquidity rally" can ensue. By the way American taxpayer - you are funding the bailout of European banks (which really is what this is at the heart of it all) via your majority funding of IMF. Thank you ... again.
- While European banks had claims on Greece totaling $193.1 billion at the end of 2009, that number is dwarfed by their $832.3 billion exposure to Spain and the $240.5 billion with Portugal.
--------------------------------
A quick word on some economic data which was overshadowed last week. There are two employment reports each month but the more widely followed one (which most likely is less accurate at turning points) signaled 290,000 job gains. Ex census workers 224,000. But ex the magical "birth death model" (which creates jobs out of thin air from businesses too small to measure) it was about 36,000 jobs. Yes folks 188,000 birth death model jobs. Maybe in reality small businesses (lacking credit) added 300,000... or 500,000... or 0. I certainly don't know. I am simply pointing out how much of the good news was either census workers or made up numbers...
This week, it is very quiet actually on the economic front. Bernanke apparently speaks twice - Monday & Thursday... if the Fed every raises rates again (don't laugh) it will be forecast to markets in speech first. I see no chance of this anytime soon. Lots of bond auctions but other than that nothing too earth shattering until Friday's retail report, industrial production and consumer sentiment.
----------------------------------
As for the portfolio, I am happy with the process last week - the only thing I screwed up were shorter term index trades. In terms of core position, one after the other popped out as it broke support (mostly the 50 day moving averages) so when the flush out happened, aside from a handful of positions we were already "out" having moved down from 44% long exposure 2 weeks ago to under 14% when the flush happened. Another 1.5% fell off the table in the huge swoosh down Thursday. I was duped by the Monday surge and had index positions in the wrong direction when Greece begin to "matter" yet again (despite the previous Sunday's bailout) Tuesday. So I took a loss that day. But a late to the game Thursday put position helped save the week - even with what I consider a poor entry point and an exit point nowhere near the lows it still pushed the portfolio to a positive for a very ugly day in the markets, and helped to make up some of the losses earlier in the week. In total portfolio value was net higher this Friday then the previous Friday protecting investors from a huge downfall in the market this week. But of course with protection (insurance) comes inability to benefit from an oversold bounce so we'll be lagging Monday morning very badly. But no real short positions are on except short bonds and long US dollar, and they are relatively minor so we won't be hurt much.
For the week on the long side:
- Monday I closed the last of coal/mining related Alpha Natural Resources (ANR) and Bucyrus (BUCY) positions as the charts had rolled over late the previous week. Bucyrus actually went from breaking below its 50 day moving average late last week to breaking the 200 day last Friday. Ditto for ANR - ugly set ups but now they can gap up Monday on Euro party time.
- Tuesday as the market had a big hit, some of our charts began to break down so I took action: Atheros Communication (ATHR) broke its 50 day, I cut the stake by 75%; took more profits (1/3rd of remaining position) in homebuilder Lennar (LEN) simply to lock them in, in case the market took them away; cut Riverbed Technology (RVBD) in half to lock in profits as there was a gap that looked like it needed to be filled; sold half of Skyworks Solutions (SWKS) to lock in profits as it had a similar "gap" situation as Riverbed.
- Wednesday, as the market fell again - more stop losses. I closed completely out of L&L Energy (LLEN), 2/3rds of Discover Financial (DFS), and 2/3rds of Quality Systems (QSII).
- Thursday morning, stopped out of 2/3rds of Indian bank HDFC Bank (HDB).
- Restarted a smallish position in industrial name Cummins (CMI).
- I assumed the Greece bailout was "in the market" and with the S&P 500 below the 20 day had some SPY puts on from late last week; those were stopped out for loss Monday as the S&P 500 broke back ABOVE the 20 day.
- I tried another SPY put position (along with short TNA ETF) Wednesday - but a 20 minute splurge over 1172.50 which was my stop out area caused me to stop out... and of course the market promptly rolled over after spiking to 1176 for only a very short while. Another loss.
- After the S&P 500 had broken January 2010 highs of 1150 and seemed to still be going down, I placed some small exposure into SPY puts in the 1130s, within 30 minutes the S&P 500 crashed and I sold at some level - no idea where but the position obviously paid off. Wish it had been bigger.
Unfortunately we have a lot of broken charts on the long side, and the gap up Monday is going to simply create reversals with new gaps that need to be filled in most names. One thing to keep an eye on is how these charts act once the stocks do their dead cat bounces into support they broke last week.
© 2024 Benzinga.com. Benzinga does not provide investment advice. All rights reserved.
Comments
Loading...
Posted In: Coal & Consumable FuelsCommunications EquipmentConstruction & Farm Machinery & Heavy TrucksConsumer DiscretionaryConsumer FinanceDiversified BanksEnergyFinancialsHomebuildingIndustrialsInformation TechnologySemiconductorsSystems Software
Benzinga simplifies the market for smarter investing
Trade confidently with insights and alerts from analyst ratings, free reports and breaking news that affects the stocks you care about.
Join Now: Free!
Already a member?Sign in

