


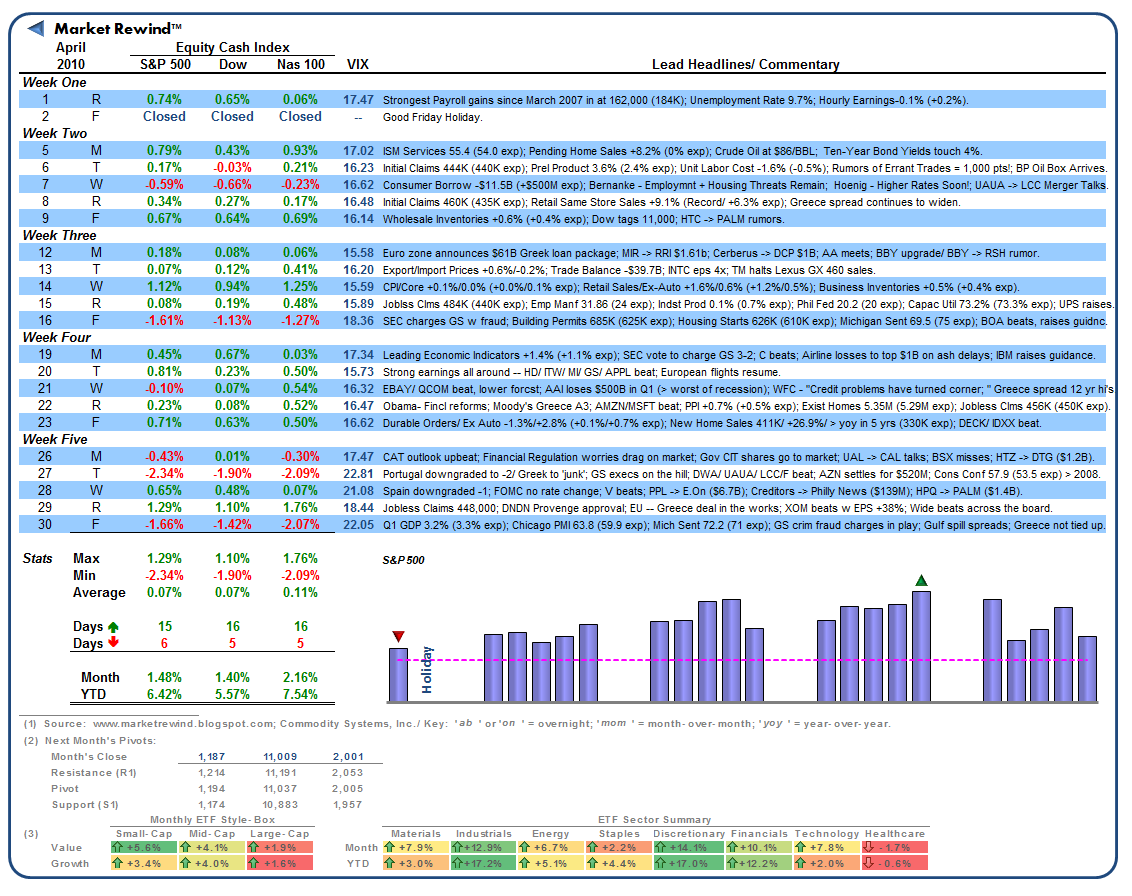
 Although April finished the month near bull-run highs, equity prices began to show signs of increased volatility towards the top as the specter of sovereign debt downgrades came back to the fore along with a whole host of additional worries [also see February].
The S&P 500, Dow Jones Industrials and NASDAQ 100 cash indices nevertheless finished higher across the board by +1.48%, +1.40% and +2.16%, respectively. At this point we all know how this story unfolded. After the cascade failure on the sixth and subsequent "nuclear" weekend Euro bailout, equities are again marching higher. However, with volatility back in the markets for now, traders will naturally be looking at those prior highs with a leary eye.
Sentiment: Positive
Volatility: Low (VIX 15-22)
Direction: Highly Positive
[Click to Enlarge/ Weekly ETF Analyses/ Prior Monthly Summaries/ Mrkt Rotation Selections]
The Style-Box was calculated using the following PowerShares™ ETFs: Small-Growth (PWT), Small-Value (PWY), Mid-Growth (PWJ), Mid-Value (PWP), Large-Growth (PWB), and Large-Value (PWV). The Sector-Ribbon was calculated using the following Select Sector SPDR™ ETFs: Materials (XLB), Industrials (XLI), Energy (XLE), Staples (XLP), Discretionary (XLY), Financials (XLF), Technology (XLK), and Healthcare (XLV). The Standard & Poors 500, Dow Jones Industrial Average and NASDAQ 100 may be traded through ETF proxies, including the SPY or IVV, DIA and QQQQ, respectively.
PWPPerella Weinberg Partners
$22.89-3.21%
PWVInvesco Large Cap Value ETF
$59.72-0.65%
XLBMaterials Select Sector SPDR
$88.44-0.92%
XLESPDR Select Sector Fund - Energy Select Sector
$90.82-0.46%
XLFSPDR Select Sector Fund - Financial
$51.06-0.93%
XLISPDR Select Sector Fund - Industrial
$137.24-0.99%
XLKSPDR Select Sector Fund - Technology
$234.64-0.72%
XLPSPDR Select Sector Fund - Consumer Staples
$80.33-0.34%
XLVSPDR Select Sector Fund - Health Care
$146.220.13%
XLYSPDR Select Sector Fund - Consumer Discretionary
$223.12-0.29%
© 2025 Benzinga.com. Benzinga does not provide investment advice. All rights reserved.
Benzinga simplifies the market for smarter investing
Trade confidently with insights and alerts from analyst ratings, free reports and breaking news that affects the stocks you care about.
Join Now: Free!
Already a member?Sign in

