Zinger Key Points
- Energy and food prices have soared 34.6% and 10.1%, respectively, over the past 12 months
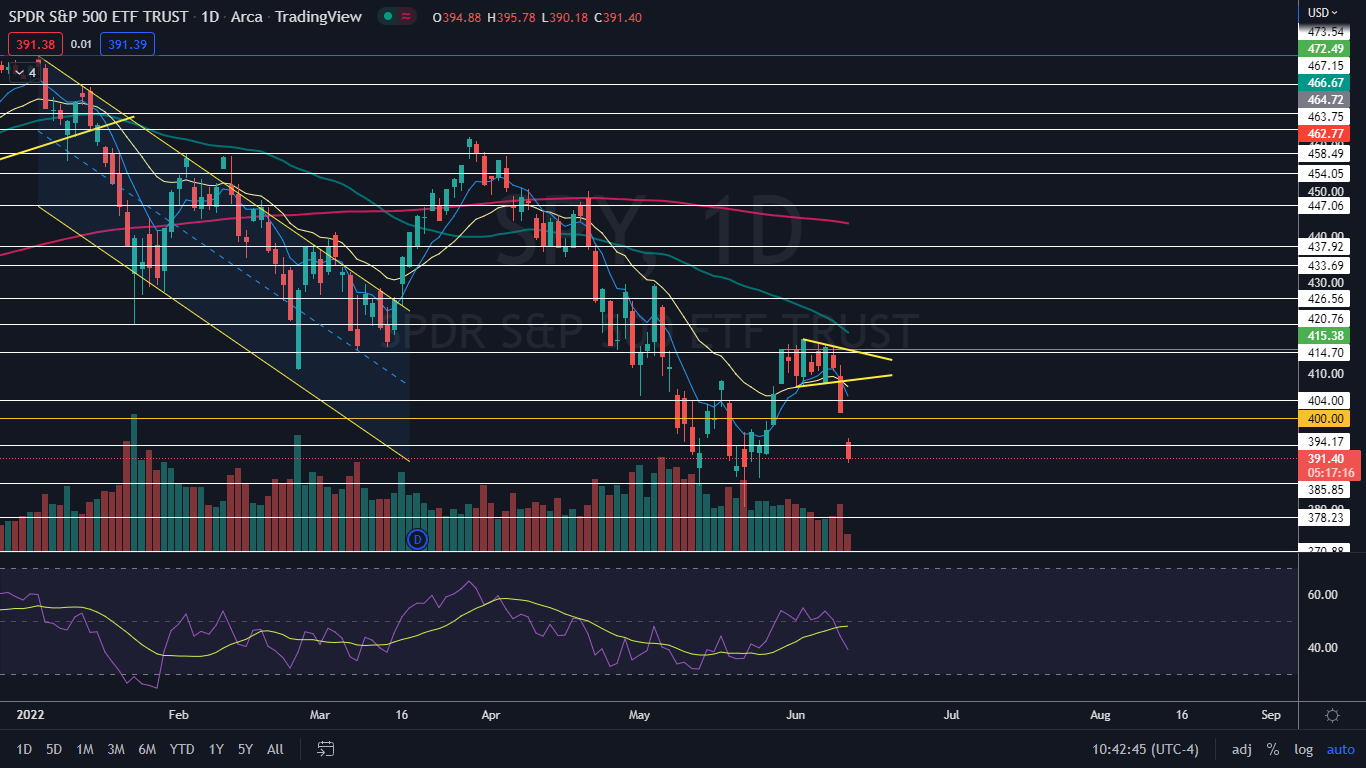
- The SPY's decline on Friday caused the ETF to open the trading session under the psychologically important $400 level
- Get Wall Street's Hottest Chart Every Morning
The SPDR S&P 500 SPY gapped down 1.63% on Friday after new Consumer Price Index (CPI) data released by the Labor Department showed the Federal Reserve is losing the fight against inflation.
The CPI increased 8.6% before adjustment over the past 12-month period, coming in almost half a percentage point above the consensus estimate of 8.2%. Inflation hasn’t soared this quickly in over 40 years.
Consumers are feeling pain at the gas pumps and the supermarkets as the cost of essentials skyrockets. The average price for a gallon of gasoline neared $5 in the U.S. on Thursday, coming in at $4.97, and nearly half of the country is already paying above $5, with 21 states and Washington D.C. already surpassing that level.
Energy and food prices have soared 34.6% and 10.1%, respectively, over the past 12 months compared to U.S. wages, which rose 5.2% year-over-year in May.
The news spooked investors who fear surging prices will force Americans to spend less, which could throw the U.S. into a recession and by late Friday morning, the SPY was plunging almost 3%.
Want direct analysis? Find me in the BZ Pro lounge! Click here for a free trial.
The SPY Chart: On Thursday, the SPY plunged 1.95% during the last two hours of the trading day as fear selling hit the market and investors prepared for a miss on CPI data. This caused the SPY to close at its low-of-day price, which indicated lower prices were likely to come on Friday.
- The sharp end-of-day decline also caused the SPY to drop down bearishly from a triangle formation that the SPY started trading in on June 1. That move came on higher-than-average volume on lower time frames, which indicated the pattern was recognized.
- The decline on Friday caused the SPY to open the trading session under the psychologically important $400 level, which is likely to act as heavy resistance on the next rebound to the upside.
- If the SPY closes the trading session near its low-of-day price, the ETF will print a bearish kicker candlestick, which could indicate lower prices will come again on Monday. If the SPY is able to close with a long lower shadow, the ETF will print a hammer or dragonfly candlestick, which could indicate a bounce to the upside is on the horizon.
- There is also a chance the SPY will set up an inside bar pattern on Monday, in order to consolidate the sharp drop. If that happens, the pattern will lean bearish because the ETF was trading lower before forming the inside bar.
- The SPY has resistance above at $394.17 and $400 and support below at $385.85 and $378.23.
 See Also: What To Expect From The Fed’s Quantitative Tightening
© 2025 Benzinga.com. Benzinga does not provide investment advice. All rights reserved.
Trade confidently with insights and alerts from analyst ratings, free reports and breaking news that affects the stocks you care about.