Zinger Key Points
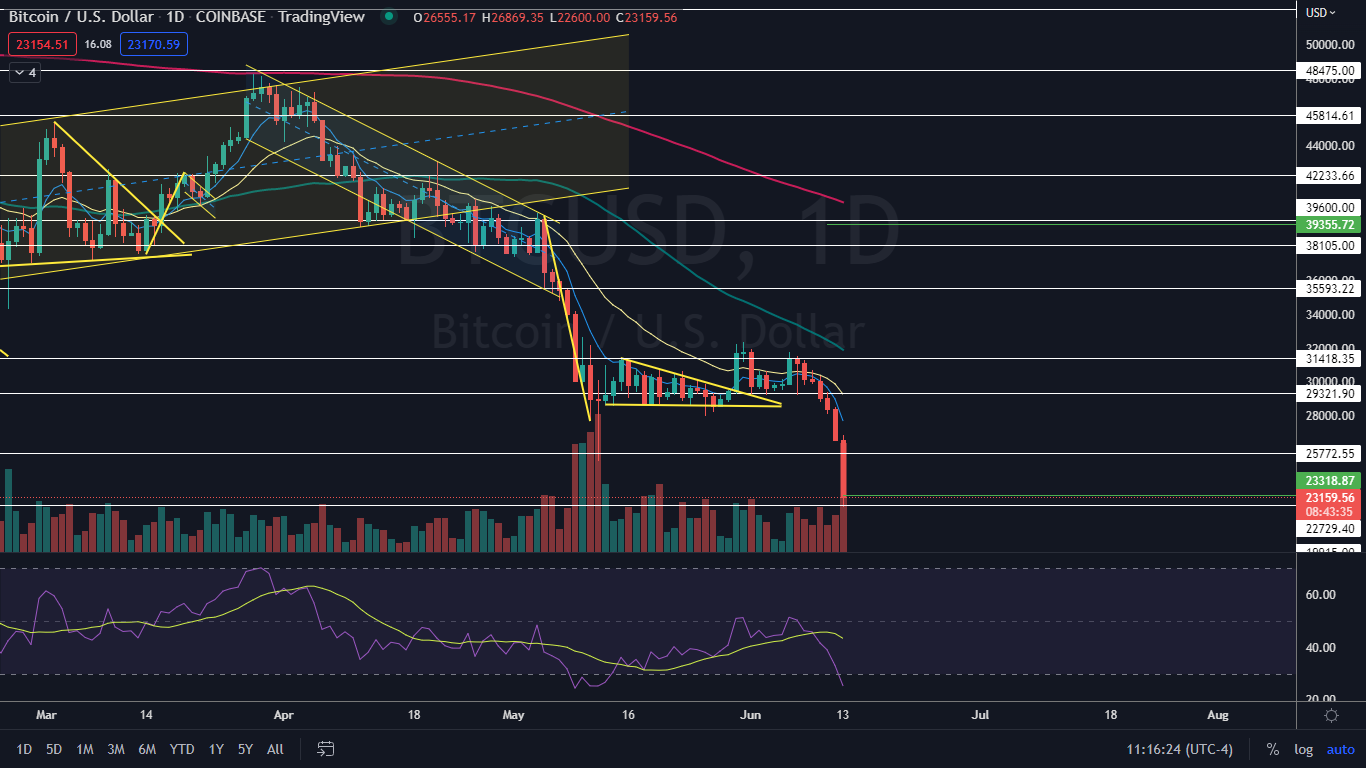
- The $22,600 mark, a level not seen since Dec. 24, 2020, has historically acted as an important level of support and resistance.
- Bitcoin's decline came on much higher-than-average volume, which indicates extreme fear.
- Today's manic market swings are creating the perfect setup for Matt’s next volatility trade. Get his next trade alert for free, right here.
Bitcoin BTC/USD was plunging more than 14% on Monday with strong momentum after a bearish weekend, which saw the apex crypto lose 8.62% over the 24-hour trading periods on Saturday and Sunday.
The price action in the crypto sector spooked investors in the stock market because weekend price action in Bitcoin and Ethereum ETH/USD often suggests the direction the general markets will take on Monday. That held true and on Monday morning the S&P 500 gapped down and continued to fall intraday, declining about 3.4% by press time.
On Sunday, Celsius, a cryptocurrency trading platform, announced it was pausing all withdrawals, swaps and transfers between accounts “due to extreme market conditions.” The news set off alarm bells as the platform’s users woke up Monday morning unable to manage their trades and investments on the app, as they watched their account balance in free fall.
Although Celsius runs on the Ethereum network, fear other crypto lending firms could follow suit may have caused traders to begin withdrawing cashing out their positions and withdrawing their funds, adding further downside pressure to the sector as a whole.
As summer approaches for the northerm hemisphere, it appears more and more likely a crypto winter is upon us. The last crypto winter, which occurred between the beginning of 2018 and lasted until mid-2020, is remembered by many in the sector because of the length of time it took for various coins and tokens to recover. The crypto sector has been in decline since November of 2021 and if this bearish cycle is similar to the last one, the pain could stick around for another two years.
Want direct analysis? Find me in the BZ Pro lounge! Click here for a free trial.
The Bitcoin Chart: On Monday, Bitcoin fell to the $22,600 mark, a level not seen since Dec. 24, 2020, which has historically acted as an important level of support and resistance. The decline further confirmed the crypto is trading in a downtrend, with the most recent lower high printed on June 6 at $31,745 and the most recent lower low formed at the $29,200 mark the following day.
- Although Bitcoin’s chart appears bearish for the longer-term, a bounce to the upside, at least to print its next consecutive lower high is likely to come over the next few days because on Monday, Bitcoin’s relative strength index (RSI) plummeted to 24%. When a stock or crypto’s RSI reaches or falls below the 30% level it becomes oversold, which can be a buy signal for technical traders looking for a short-term trade.
- The move lower came on much higher-than-average volume, which indicates extreme fear. At press time, Bitcoin’s volume was measuring in at about 55,000 on Coinbase compared to the 10-day average of 14,734.
- If Bitcoin closes the trading day near its low-of-day price, the crypto will print a bearish Marubozu candlestick, which could indicate lower prices will come again during the next 24-hour period. If the bulls are able to hold the crypto above the $22,600 level and drive the price up so that the candle forms a lower shadow, a larger bounce could be on the horizon.
- Eventually, Bitcoin will need to begin a sideways consolidation pattern on declining volume as the selling lessons. Traders and investors can watch for patterns to form within the consolidation in order to gauge future direction.
- Below the $22,600 level there is psychological support at $20,000 and price history support at $19.915. Bitcoin has resistance above at $25,772 and $29,321.50.
 See Also: What Is Bitcoin's Price Right Now?
Photo: Ja Crispy via Shutterstock
Edge Rankings
Price Trend
© 2025 Benzinga.com. Benzinga does not provide investment advice. All rights reserved.
Trade confidently with insights and alerts from analyst ratings, free reports and breaking news that affects the stocks you care about.