Zinger Key Points
- Apple is likely to bounce up over the coming days, but will then likely continue in the downtrend.
- On June 3, Apple’s 50-day SMA crossed below the 200-day SMA, which caused a death cross to form.
- Brand New Membership Level: Benzinga Trade Alerts
Apple, Inc AAPL opened slightly higher on Tuesday before falling down to test Monday’s low-of-day as support.
The S&P 500 officially entered into a bear market on Monday, declining more than 20% from the Jan. 4 all-time high of $4,818.62. Apple has similarly declined about 28% from that same date, which isn’t surprising considering the tech giant has the highest weighting of any stock in the ETF, making up 6.2% of the fund.
The heavy decline may have some investors wondering when would be a good time to start averaging into the stock.
Bear cycles in the stock market are healthy and historically much more short-lived than the long bull cycles that dominate. Newer retail investors may have experience with the crash caused by the COVID-19 pandemic, and few likely participated in the market during the last true bear cycle, which took place between October 2007 and March 2009.
During that bear cycle, known as the Financial Crisis, the S&P 500 plunged almost 57% over the course of 17 months. The cycle was followed by a multi-year bull cycle, that saw the ETF soar 621% between March 2009 and January 2021.
Apple plunged 57% during the Financial Crisis to open the month of March 2009 at the equivalent (if the company hadn’t split its stock twice since then) of $2.94. Since that date, Apple soared 6,167% to reach an all-time high of $182.94. That means, if an investor had purchased $1000 worth of Apple stock at the March 2009 low and sold the investment until Jan. 4, 2021, they would have turned the original investment into a whopping $61,224.49 over the course of about 13 years.
After this current bear cycle is finished, the most likely scenario is that the market will make another multi-year run, probably with similar gains, and over the coming months, investors will be watching for signals to indicate the market has found a bottom. Finding the bottom is a difficult task, however, and few will be successful at catching the lowest prices.
Knowing this, investors may choose to use the technique of dollar cost averaging, where the total sum an investor plans to purchase of a security is divided up into parts and invested periodically in order to reduce any negative effects caused by volatility.
Other investors, especially those who use technical analysis to time their trades, may choose to look for signs and signals that the bear cycle is over, which often requires being late on an entry. One technical signal that could suggest the bear cycle is over could be waiting for the 50-day simple moving average (SMA) to cross above the 200-day SMA.
Regardless of the techniques an investor may use, over the coming months there will likely be great opportunities to take advantage of the bear market in order to profit over the long-term.
Having patience will likely be the key, especially with Apple because from a technical standpoint, the stock looks to be headed lower.
Want direct analysis? Find me in the BZ Pro lounge! Click here for a free trial.
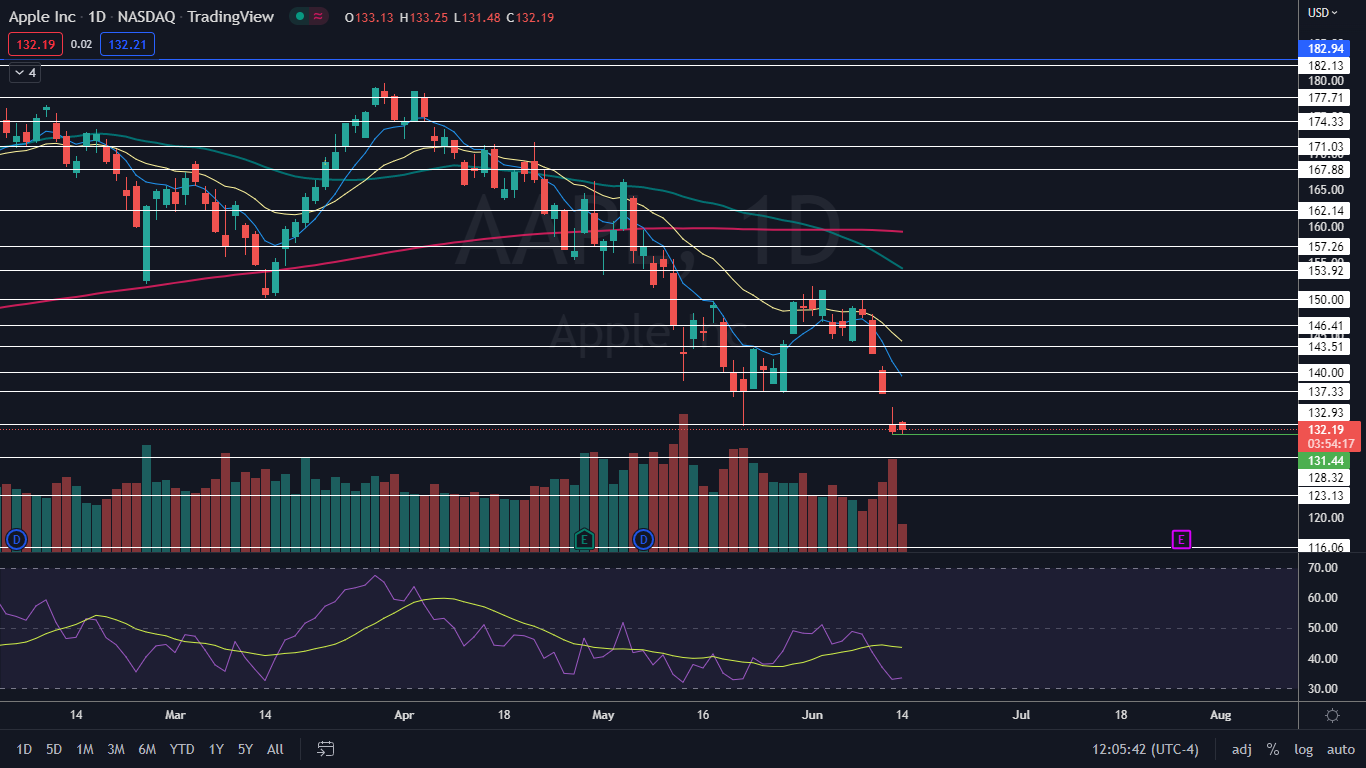
The Apple Chart: On Tuesday, Apple was trading in an inside bar pattern, with all of the price action taking place within Monday’s mother bar. That pattern leans bearish in this case because Apple was trading lower before forming the pattern and because the inside bar is forming at the lower range of the mother bar.
- Although Apple is likely to bounce up over the coming days, the most likely scenario is that the stock will print a lower high and then continue in the downtrend Apple has been trading in since March 30.
- On June 3, Apple’s 50-day SMA crossed below the 200-day SMA, which caused a death cross to form and indicate Apple is in a bear cycle. For long term conservative investors, waiting for the 50-day SMA to cross back over the 200-day and form a golden cross is likely the safest bet.
- Apple has resistance above at $132.93 and $137.33 and support below at $128.32 and $123.13.

See Also: How To Trade High-Growth FANG Stocks In A Panicky Market
© 2025 Benzinga.com. Benzinga does not provide investment advice. All rights reserved.
Trade confidently with insights and alerts from analyst ratings, free reports and breaking news that affects the stocks you care about.