Zinger Key Points
- Analysts estimate Microsoft will print earnings per share of $2.30 on revenues of $52.47 billion.
- The reaction to Microsoft's earnings will likely dictate the longer-term price action.
- Get 5 stock picks identified before their biggest breakouts, identified by the same system that spotted Insmed, Sprouts, and Uber before their 20%+ gains.
Microsoft Corporation MSFT is set to print its fiscal fourth-quarter and full-year financial results after the market closes on Tuesday. The stock was trading about 3.5% lower heading into the event.
When the tech giant printed its third-quarter results on April 26, the stock gapped up over 4% the following day but eventually resumed its downtrend, which brought Microsoft shares to a 14-month low of $241.51 on June 14.
For the third quarter, Microsoft reported an EPS of $1.95 on revenue of $41.7 billion. Both numbers topped consensus analyst estimates of $1.78 and $41 billion, respectively.
For the fourth quarter, analysts estimate Microsoft will print earnings per share of $2.30 on revenues of $52.47 billion.
Satori Fund founder and portfolio manager Dan Niles said Monday on CNBC's "Closing Bell" said that he is short Microsoft ahead of its earnings event. Niles believes the high growth Microsoft enjoyed in its Azure cloud segment may have concluded with COVID-19 restrictions ending and people spending less time online.
On Tuesday morning, Rosenblatt analyst Blair Abernethy maintained a buy rating on Microsoft, but lowered the price target from $349 to $330.
From a technical analysis perspective, Microsoft’s stock looks set to fall lower over the coming days, but it should be noted that holding stocks or options over an earnings print is akin to gambling because stocks can react bullishly to an earnings miss and bearishly to an earnings beat. Options traders, particularly those who are holding close dated calls or puts, take on extra risk because the intuitions writing the options increase premiums to account for implied volatility.
Want direct analysis? Find me in the BZ Pro lounge! Click here for a free trial.
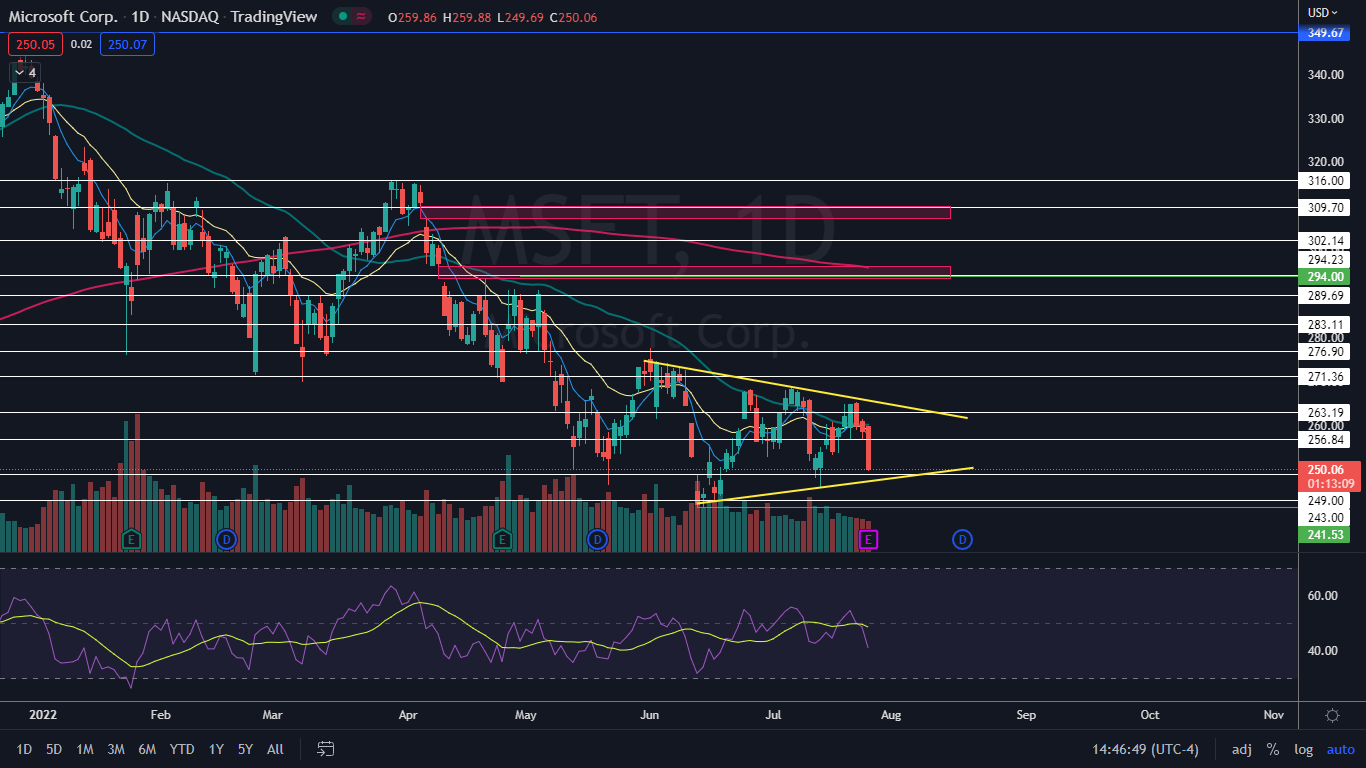
The Microsoft Chart: Microsoft began trading under a descending trendline on May 31 and on June 13, the stock began to trade above an ascending trendline, which may be settling Microsoft into a large symmetrical triangle. On Tuesday, Microsoft was falling toward the lower line of the pattern and may find support there if the stock falls further.
If Microsoft closes the trading day near its low-of-day price, the stock will print a bearish Marubozu candlestick, which could indicate lower prices will come again on Wednesday. The second most likely scenario is that Microsoft will print an inside bar to consolidate the steep drop.
If Microsoft drops down through the bottom trendline of the pattern on higher-than-average volume, a larger downtrend may be on the horizon. If Microsoft receives a bullish reaction to its earnings print and is able to break up from the upper trendline of the pattern, the weekly uptrend could be in the cards.
Microsoft has resistance above at $256.84 and $263.19 and support below at $249 and $243.

See Also: Fear Among Investors Increases Slightly Ahead Of Big Earnings, Fed Decision
© 2025 Benzinga.com. Benzinga does not provide investment advice. All rights reserved.
Trade confidently with insights and alerts from analyst ratings, free reports and breaking news that affects the stocks you care about.