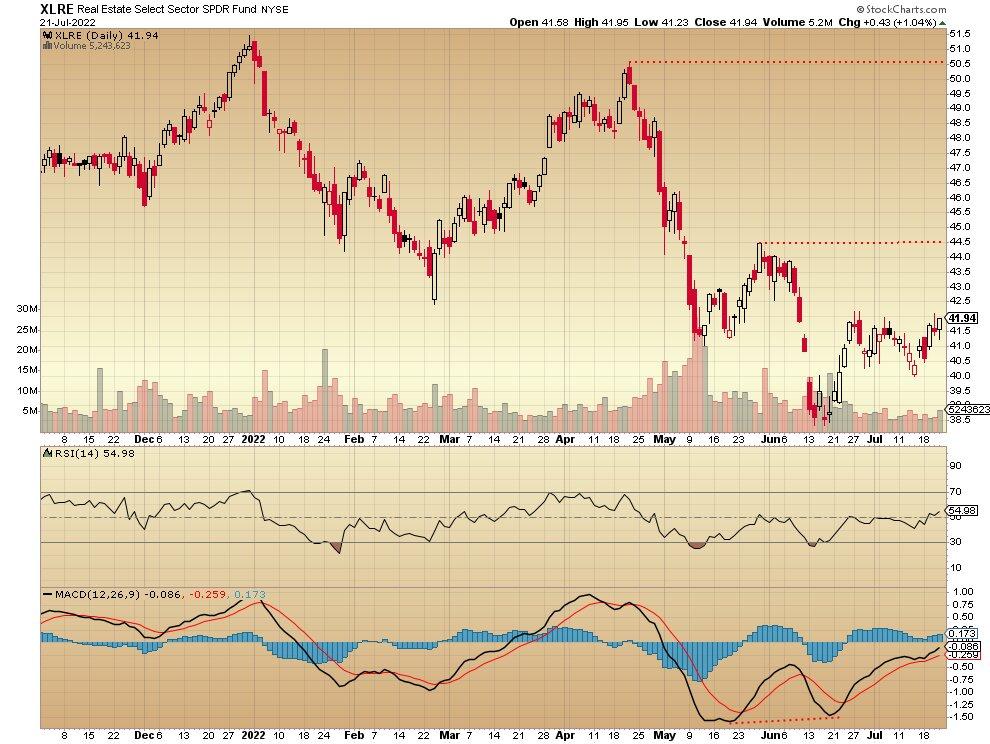
The benchmark measure for publicly traded real estate investment trusts (REITs) is the Real Estate Select Sector SPDR Fund XLRE. Take a look at how it’s fallen this year, mostly in April and May:
Related: This Non-Listed Real Estate Fund Continues To Outperform Publicly Traded REITs

From 51 at the beginning of January to a low of 38.50 by mid-June before a bounce back up to 41, that’s quite a ride for a group of dividend-paying REITs. From the standpoint of price chart analysis, it’s a hopeful sign to see positive divergence of the moving average convergence/divergence (MACD) indicator from mid-May to mid-June. It’s clear that the price action from the divergence has been upward. Let’s see if the buying continues into late summer.
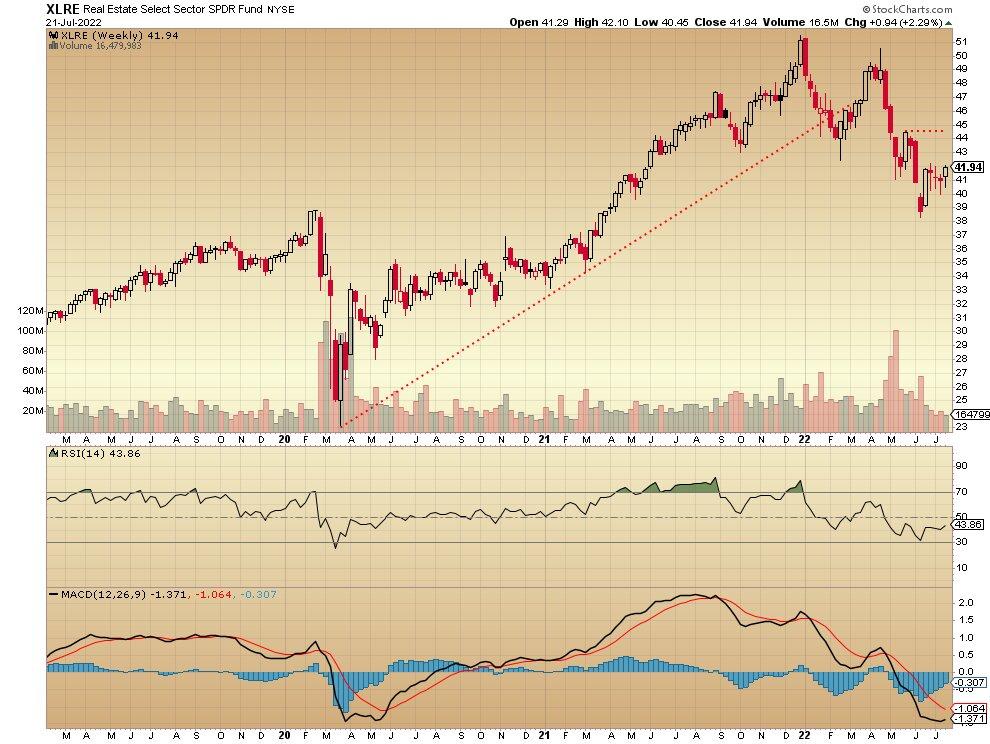
XLRE weekly 7-21-22

That’s a beautiful up trend from the March 2020 pandemic low up to the December 2022 high. It’s hard to complain too much about a two-year rally as they don’t come around all that often. The year 2022 is another story, obviously, as that red-dotted uptrend line is broken and a spring rally attempt fails to hold. A clear feature of the May trading is the huge red (selling) volume bar visible along the bottom of the price chart — similar to the March 2020 unloading. Is this enough selling for a cycle low?
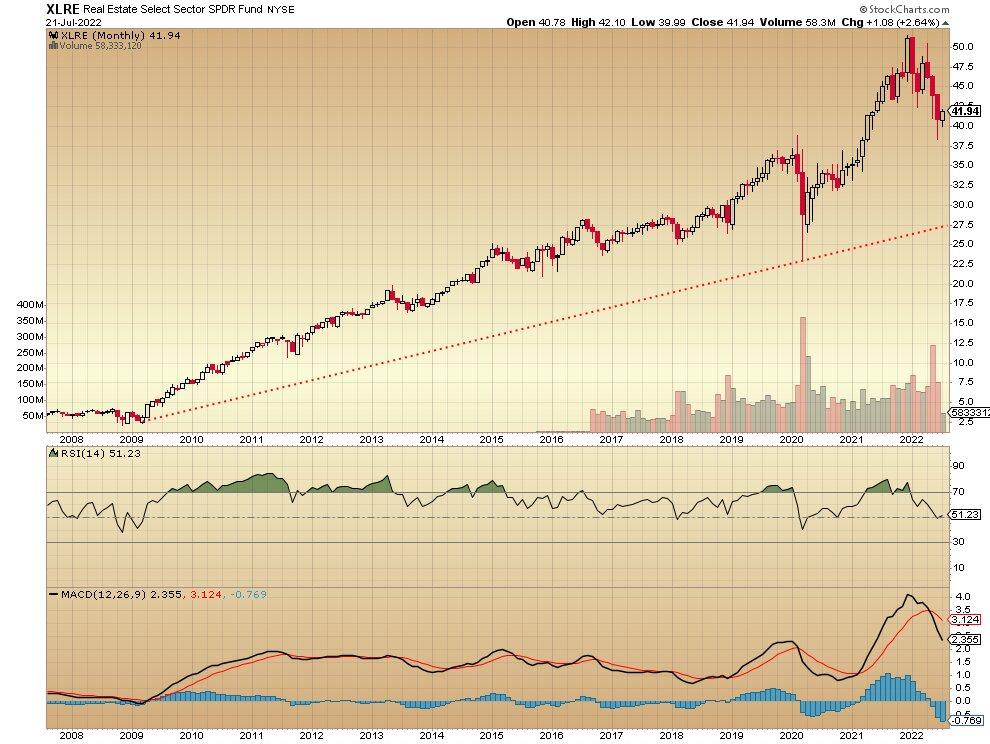
XLRE monthly 7-2-22:

If you are a long-term investor who buys and holds, this is the kind of chart you’re looking for — especially if you started buying when no one wanted to back in 2008/2009. The red dotted line that connects those lows with the March 2020 dip continues upward, unbroken, a good sign. This REIT exchange-traded fund (ETF) can continue to sell off for a while and remain in a long-term uptrend as long as it trades above $27.50.
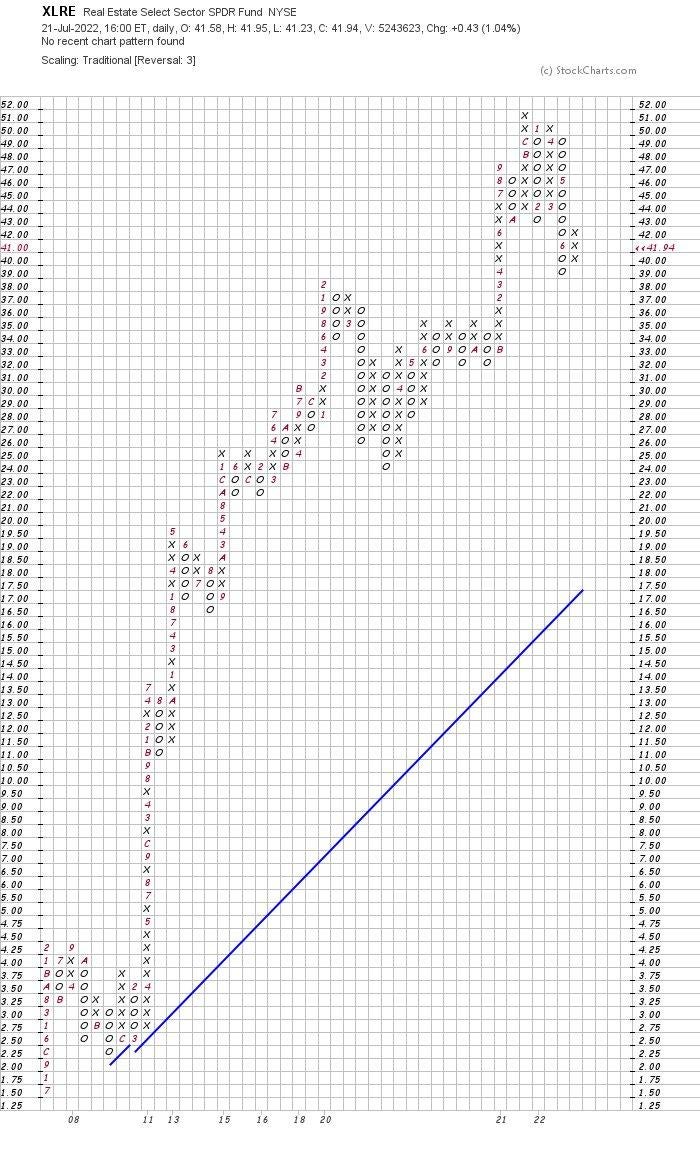
For another perspective, below is the classic point-and-figure chart for the Real Estate Select Sector SPDR Fund.

It’s clear that price remains in a long-term uptrend, despite the recent selling. No judgement about short-term future direction can be made for sure. A break above 51 might be bullish and a break below 39 might suggest lower still. Those levels are easy to make out on the point and figure chart.
The top 10 holdings of the Real Estate Investment Trust SPDR fund are:
- American Tower Corp AMT at 13.10% of assets.
- ProLogis Inc PLD at 9.43%.
- Crown Castle International Corp CCI at 8.99%
- Equinix Inc EQIX at 7.44%.
- Public Storage PSA at 4.88%.
- Simon Property Group Inc SPG at 4.57%.
- Digital Realty Trust Inc DLR at 4.52%.
- SBA Communications Corporation SBAC at 3.72%.
- Welltower Inc WELL at 3.70%.
- AvalonBay Communities Inc AVB at 3.11%.
Looking for ways to boost your returns? Check out Benzinga's coverage on Alternative Real Estate Investments:
- Exclusive Offering For 3 Large-Scale Real Estate Developments In Markets That Have A Growing Demand For Rental Units
- This REIT You've Probably Never Heard of Has Paid a Dividend Above 8% For The Last 5 Years
- Like Dividends? Then You’ll Love These High-Yield Investments
Or browse current investment options based on your criteria with Benzinga’s Offering Screener.
Not investment advice. For educational purposes only.
Photo by Vintage Tone on Shutterstock
Charts by StockCharts
© 2024 Benzinga.com. Benzinga does not provide investment advice. All rights reserved.
Comments
Trade confidently with insights and alerts from analyst ratings, free reports and breaking news that affects the stocks you care about.