Zinger Key Points
- Occidental is trading in a confirmed uptrend on the daily chart.
- The stock is also trading in a bullish inside bar pattern and may form a series of inside bars to continue consolidating.
- Get access to your new suite of high-powered trading tools, including real-time stock ratings, insider trades, and government trading signals.
Occidental Petroleum Corporation OXY opened lower on Monday after a big bullish day on Friday saw the stock rally almost 10% off Thursday’s closing price.
Occidental Petroleum surged on Friday after news dropped that Berkshire Hathaway, Inc (NYSE: BRK-A) (NYSE: BRK-B) CEO and billionaire investor Warren Buffett won approval to take up to a 50% stake in the oil giant. Prior to the approval, Berkshire reported holding a 19.4% stake in Occidental.
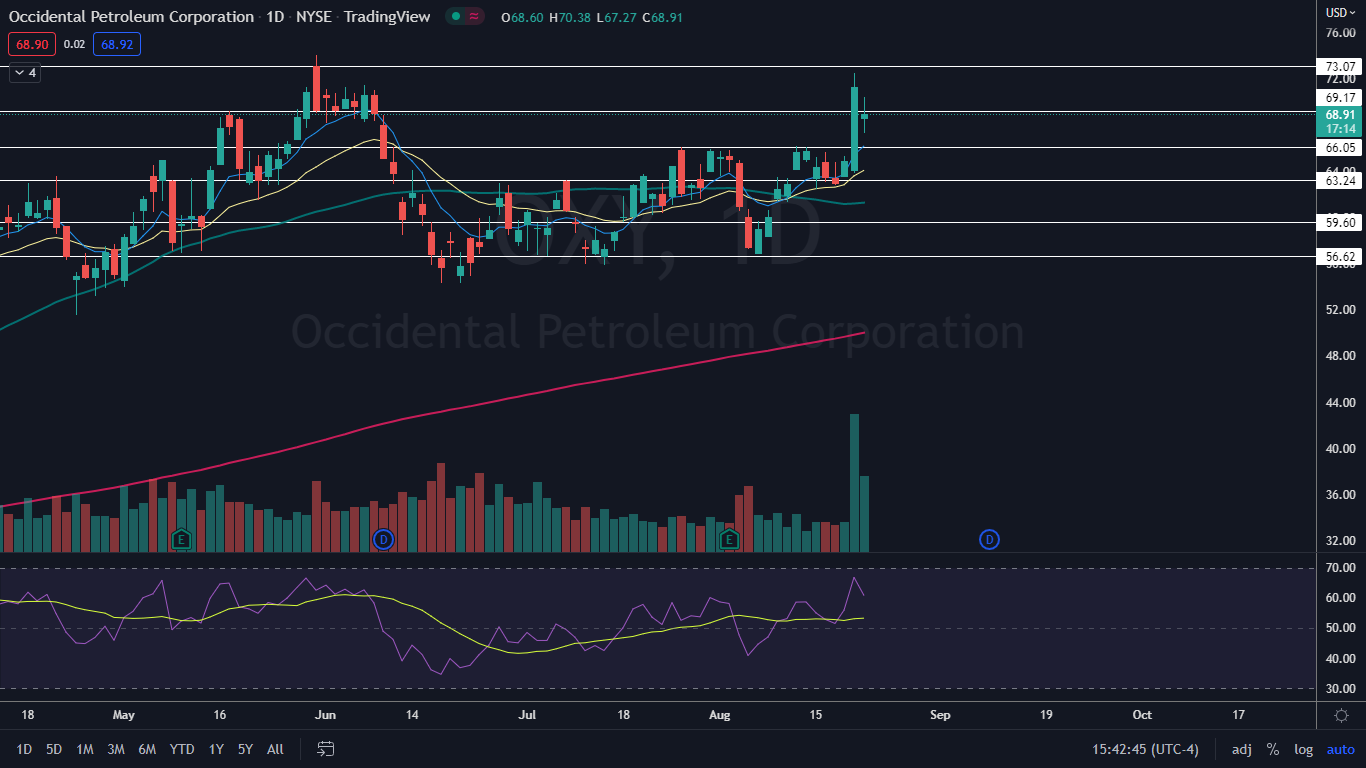
The massive increase in shares of Occidental caused the stock’s relative strength index (RSI) to soar up to the 67% mark, which indicated consolidation was likely to begin taking place, which looked to be beginning on Monday with an inside bar pattern.
An inside bar pattern indicates a period of consolidation and is usually followed by a continuation move in the direction of the current trend.
An inside bar pattern has more validity on larger time frames (four-hour chart or larger). The pattern has a minimum of two candlesticks and consists of a mother bar (the first candlestick in the pattern) followed by one or more subsequent candles. The subsequent candle(s) must be completely inside the range of the mother bar and each is called an "inside bar."
A double, or triple inside bar can be more powerful than a single inside bar. After the break of an inside bar pattern, traders want to watch for high volume for confirmation the pattern was recognized.
- Bullish traders will want to search for inside bar patterns on stocks that are in an uptrend. Some traders may take a position during the inside bar prior to the break while other aggressive traders will take a position after the break of the pattern.
- For bearish traders, finding an inside bar pattern on a stock that's in a downtrend will be key. Like bullish traders, bears have two options where to take a position to play the break of the pattern. For bearish traders, the pattern is invalidated if the stock rises above the highest range of the mother candle.
Want direct analysis? Find me in the BZ Pro lounge! Click here for a free trial.
The Occidental Petroleum Chart: Due to the size of Friday’s mother bar, Occidental may proceed to print a series of inside bars on declining volume over the next few days. The inside bar leans bullish in this case because the stock was trading higher before printing the pattern but traders can watch for an eventual break up or down from Friday’s range on higher-than-average volume to gauge the future direction.
- Occidental is trading in a confirmed uptrend, with the most recent higher low formed on Aug. 17 at $62.79 and the most recent confirmed higher high formed at the $72.49 mark on Friday. If the stock eventually breaks up from Friday’s mother bar, the inside bar(s) will serve as the next higher low within the pattern.
- The consolidation within the inside bar pattern is helping to drop Occidental’s RSI back down to a more comfortable level. When a stock’s RSI nears or reaches the 70% level it becomes overbought and Occidental’s RSI is now measuring in at about 62%.
- Occidental is trading above the eight-day and 21-day exponential moving averages (EMAs), with the eight-day EMA trending above the 21-day, both of which are bullish indicators. The stock is also trading above the 50-day simple moving average, which indicates longer-term sentiment is bullish.
- If Occidental continues to trade sideways within Friday’s mother bar over the next few days, the moving averages will catch up to the stock, which may help to push Occidental higher and potentially up above Friday’s high-of-day.
- Occidental has resistance above at $69.17 and $73.07 and support below at $66.05 and $63.24.
 See Also: Warren Buffett Is Betting Big On Occidental Petroleum, But Analyst Sees 'Better Options Elsewhere'
Photo: Thaiview via Shutterstock
© 2025 Benzinga.com. Benzinga does not provide investment advice. All rights reserved.
Trade confidently with insights and alerts from analyst ratings, free reports and breaking news that affects the stocks you care about.