
Zinger Key Points
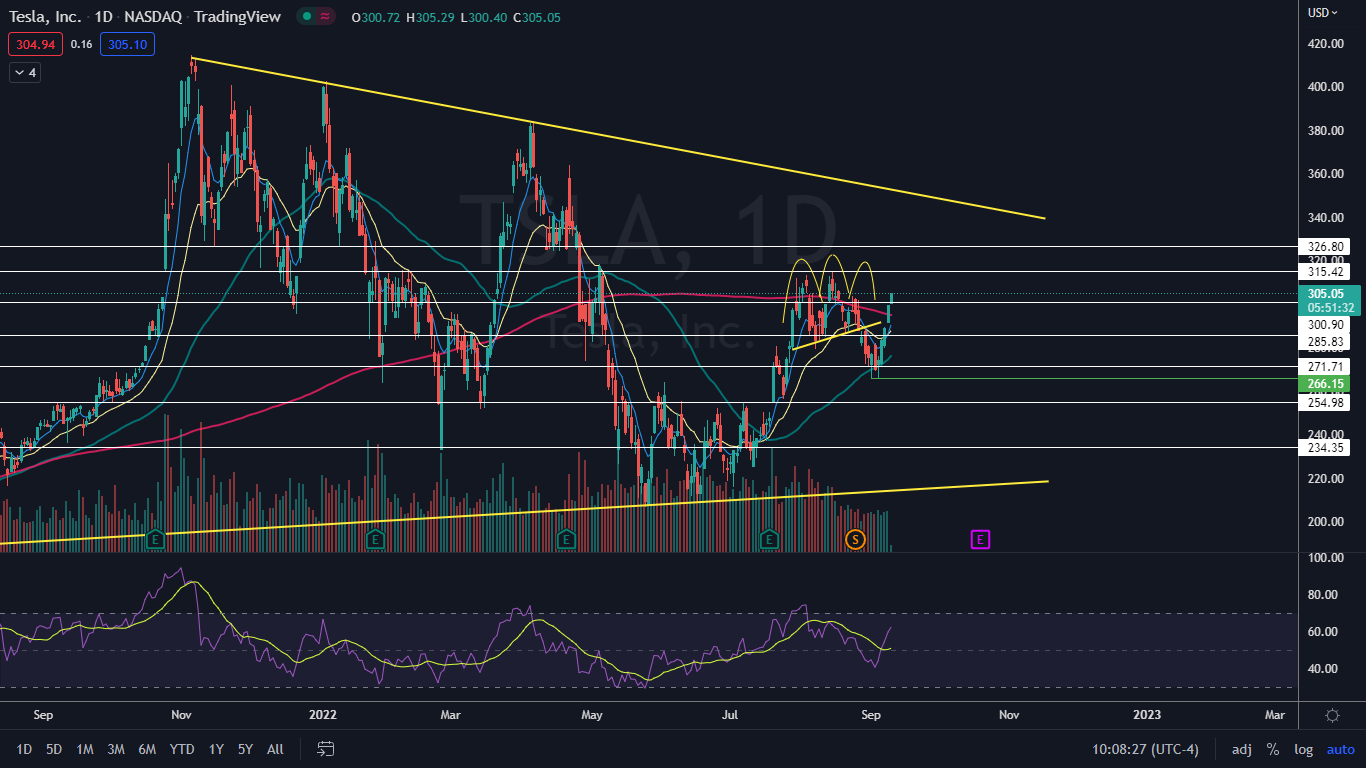
- Tesla has negated its most recent downtrend but hasn't yet confirmed a new uptrend on the daily chart.
- If Tesla closes the trading session near its high-of-day, a second bullish kicker candlestick may indicate higher prices on the horizon.
- Get the Real Story Behind Every Major Earnings Report
Tesla, Inc TSLA was spiking up over 1% higher on Monday after a big bullish day on Friday caused the stock to rise 2.9% off the open and reclaim the 200-day simple moving average (SMA) as support.
The 200-day SMA is an important bellwether. Technical traders and investors consider a stock trading above the level on the daily chart to be in a bull cycle, whereas a stock trading under the 200-day SMA is considered to be in a bear cycle.
The 50-day SMA also plays an important role in technical analysis, especially when paired with the 200-day. When the 50-day SMA crosses below the 200-day SMA, a death cross occurs, whereas when the 50-day SMA crosses above the 200-day, a bullish golden cross takes place.
A death cross occurred on Tesla’s chart in May, which dropped the stock into a long-term bear cycle. In August, Tesla popped up above the 200-day on several occasions, but was unable to hold above the level for any length of time.
When Tesla last attempted to cross above the 200-day on Aug. 24, Aug. 25 and Aug. 26, the stock rejected the area and entered a downtrend that caused Tesla to decline 12% to a Sept. 1 low of $266.15. Tesla tested that low as support again on Sept. 6, which caused the stock to print a double bottom pattern at the level.
In reaction to the bullish double bottom, Tesla rebounded about 10% and on Friday the stock crossed back up above the 200-day SMA.
Traders and investors will be watching to see if Tesla can hold above the level this time and if the stock can remain above the 200-day for a period of time, a golden cross will occur.
Want direct analysis? Find me in the BZ Pro lounge! Click here for a free trial.
The Tesla Chart: Although Tesla negated its most recent downtrend, the stock has yet to confirm a new uptrend. For an uptrend to confirm on the daily chart, Tesla will need to retrace to print a higher low. Now that Tesla is above the 200-day, the higher low may occur on a back test of that level.
- On Friday, Tesla printed a bullish kicker candlestick, which indicated the stock would trade higher on Monday. If Tesla closes the trading day Monday near the high-of-day, the stock will print a second bullish kicker candlestick, which could indicate higher prices will come again on Tuesday.
- If Tesla gaps slightly up again on Tuesday and prints a third bullish kicker candlestick, the stock may retrace on Wednesday due to the creation of a three-gap-up-reversal pattern. If the stock falls on Monday to print a shooting star candlestick, a retracement may be in the cards for Tuesday.
- If Tesla confirms an uptrend and continues to trend higher over the coming days, the stock may find resistance at the upper descending trendline of a long-term triangle pattern, which the stock has been trading in since Nov. 5, 2021. Traders looking to exit a long position or take a short position may choose to watch for Tesla to print a bearish reversal candlestick at the top of the pattern.
- Tesla has resistance above at $315.42 and $326.80 and support below at $300.90 and $285.83.
See Also: Tesla, Nio EV Battery Supplier CATL's Chinese Rival CALB Eyes $2B Hong Kong IPO: Report
© 2025 Benzinga.com. Benzinga does not provide investment advice. All rights reserved.
Trade confidently with insights and alerts from analyst ratings, free reports and breaking news that affects the stocks you care about.

