Zinger Key Points
- Meta's inverted hammer candlestick on Thursday could indicate a bounce is on the way for Friday.
- The candlestick pattern is a lagging indicator, and Friday's candlestick will need to print for confirmation.
Facebook parent company Meta Platforms Inc. META saw some volatility early in the trading session on Thursday, but by midafternoon was trading mostly flat.
Big-tech was hit hard on Tuesday after consumer price index data released by the U.S. Labor Department revealed that, although inflation may have peaked, costs haven’t come down to where analysts expected for the month of August.
For the month of August, CPI reached 8.3%, down from 8.5% in July. Economists estimated CPI would come in at 8%.
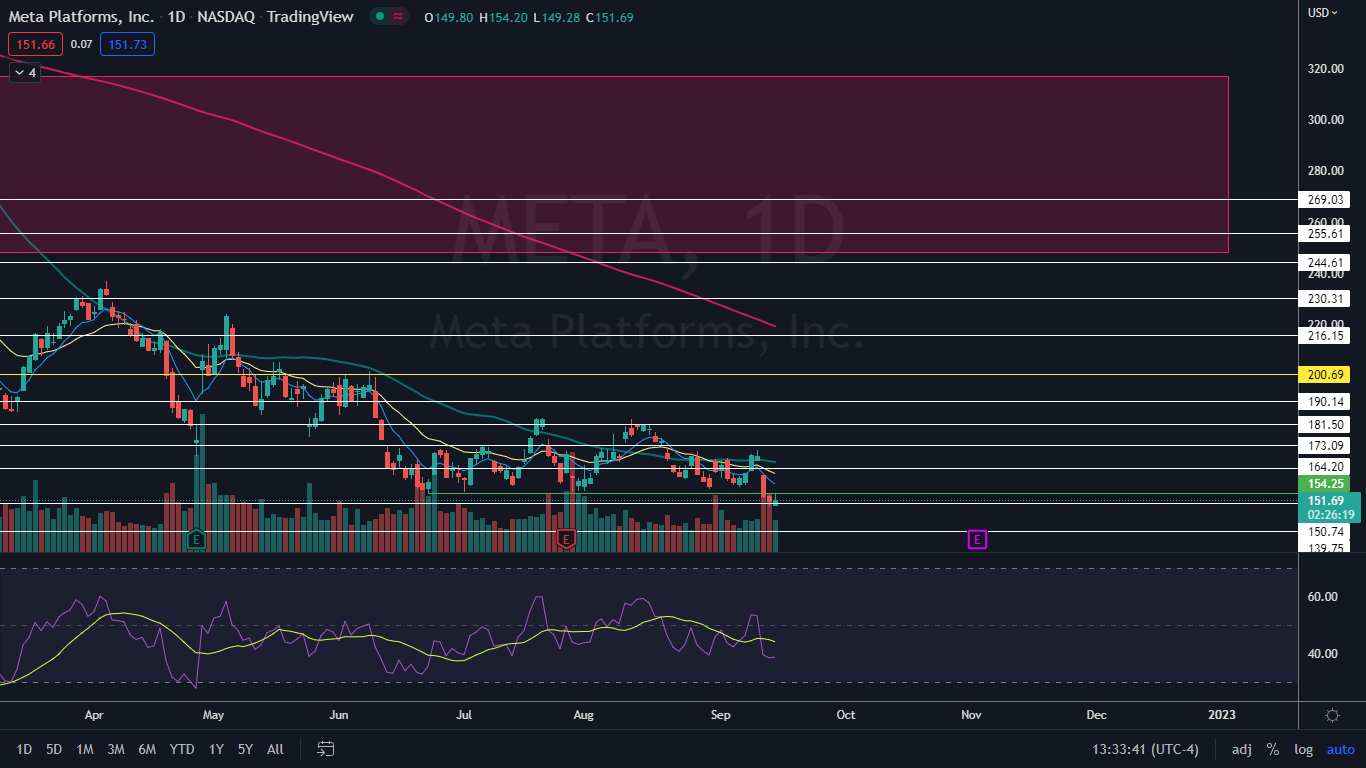
Meta’s decline continued Wednesday. By Thursday, the stock looked to be printing an inverted hammer candlestick, which could indicate that at least the temporary bottom is in, and a bounce is on the way.
An inverted hammer candlestick, when found in a downtrend, can indicate a bounce is on the horizon but it’s a lagging indicator, meaning that Friday’s candlestick will have to print to verify if the pattern was recognized.
The candlestick can be confusing because upper wicks suggest there are many sellers at higher prices, but the inverted hammer candlestick indicates that there are also many bulls who are attempting to push the price up from the low-of-day.
Want direct analysis? Find me in the BZ Pro lounge! Click here for a free trial.
The Meta Platforms Chart: If the inverted hammer candlestick is recognized, bullish traders can expect to see a bullish candlestick and higher prices come on Friday. If lower prices are on the horizon, Meta will fall to a new 52-week low, which would put the stock in danger of retracing to the COVID-19-induced March 18, 2020, low of $137.10.
- If on Friday, Meta fails to break up above Thursday’s high-of-day, the next most likely scenario is that the stock will trade sideways for a period to consolidate Tuesday’s sharp decline. If that happens, traders can watch for the consolidation to take place on decreasing volume as the market awaits the Federal Reserve’s interest rate decision on Sept. 21.
- If Meta bounces up in reaction to the inverted hammer candlestick, bearish traders can watch for the stock to potentially reject from the eight-day and 21-day exponential moving averages, which are trending at about the $158 to $162 levels. If Meta can regain the EMAs as support on a bounce, bullish traders may feel more confident going forward.
- Meta has resistance above at $164.20 and $173.09 and support below at $150.74 and $139.75.
 See Also: Tuesday's Market Bloodbath Hit The Top 10 Richest People Where It Hurts - Here's How And How Much
© 2025 Benzinga.com. Benzinga does not provide investment advice. All rights reserved.
Trade confidently with insights and alerts from analyst ratings, free reports and breaking news that affects the stocks you care about.