Zinger Key Points
- Traders and investors are anxiously awaiting the Fed's decision on interest rates expected Wednesday.
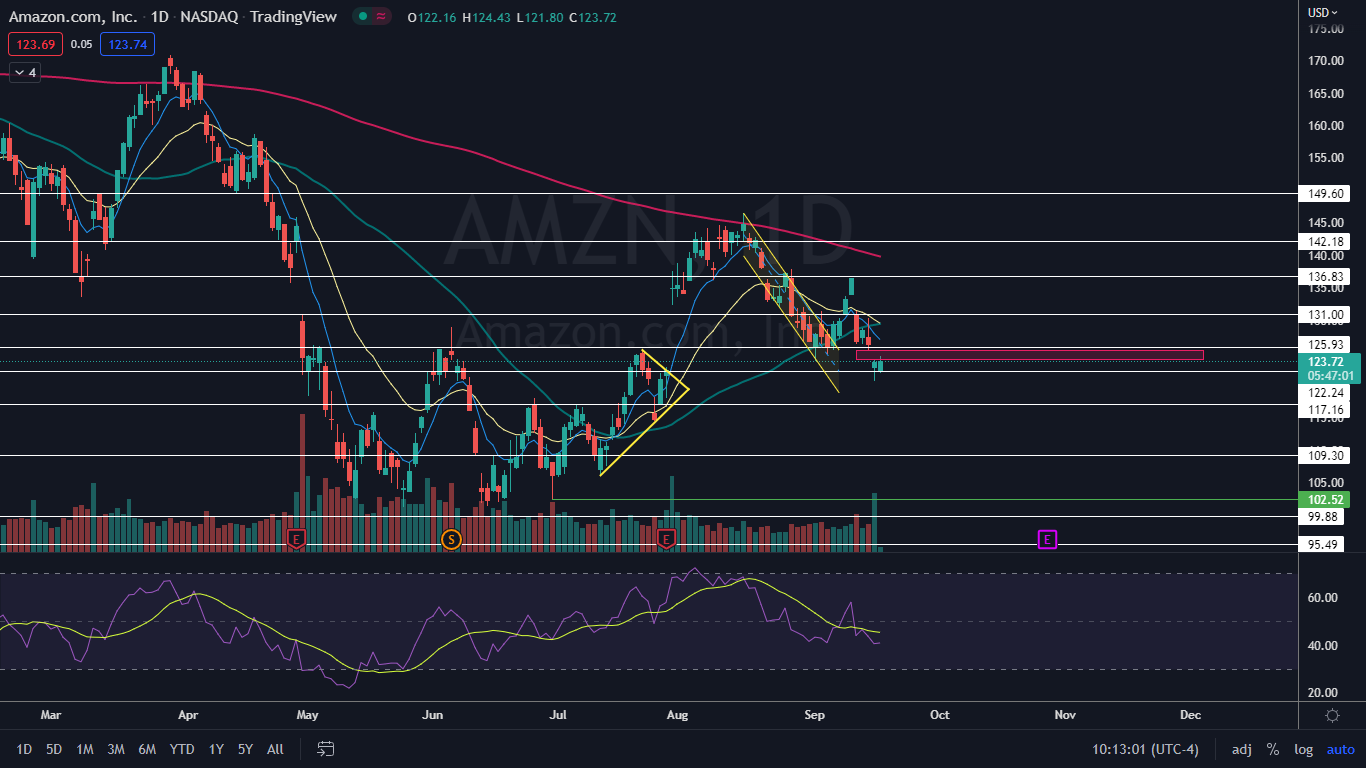
- If Amazon continues to bounce higher into the Fed's decision, traders can watch for a lower high to print at the top of the gap.
- Next: Access Our New, Shockingly Simple 'Alert System'
Amazon.com, Inc AMZN suffered a massively bearish day on Friday, gapping down to start the session and closing 2.18% lower, in line with the S&P 500, which declined 1.17%.
In the premarket Monday, Amazon was sliding about 0.7% in tandem with the market ETF. Traders and investors are anxiously awaiting the Federal Reserve’s monthly meeting minutes, set to print on Wednesday at 2:00 p.m. EDT.
Consumer price index data released by the U.S. Labor Department last week showed inflation remained elevated above expectations in August, despite four separate rate hikes initiated in March, May, June and July. The news brought fear that the Fed could hike rates by 0.75% or even by a full percentage point later this week.
Recession fears have also weighed heavily on investors and on Friday, when FedEx Corp FDX cut its first-quarter guidance and withdrew its fiscal year 2023 projections, the idea of a recession almost became a certainty.
Despite the overall bearish price movement in Amazon and the general market, stocks rarely move up or down in a straight line and on Monday, Amazon bounced up slightly and will possibly form its next lower high within the downtrend pattern.
Want direct analysis? Find me in the BZ Pro lounge! Click here for a free trial.
The Amazon Chart: Amazon bounced up briefly on Monday, partially filling the upper gap left behind on Friday. If Amazon continues to trend higher later on Monday and on Tuesday, traders and investors can watch for the stock to print a bearish reversal candlestick at the top of the gap to indicate the next lower high has occurred.
- Gaps on charts fill about 90% of the time, making it likely Amazon will rise up to fill the empty trading range. If Amazon closes Monday’s session with a long upper wick, however, the gap my not immediately close and the stock could fall lower on Tuesday.
- Bullish traders waiting for the next bounce may want to practice patience and wait to see how Amazon and the general markets react to the Fed’s decision on Wednesday. If the reaction is bearish, traders can watch for Amazon to eventually print a bullish reversal candlestick, such as a doji or hammer candlestick, to indicate the temporary bottom is in, and a spike is on the horizon.
- Amazon has resistance above at $125.93 and $131 and support below at $122.24 and $117.16.

See Also: Why Take-Two Interactive Software (TTWO) Shares Are Falling Premarket Today - Take-Two Interactive
Photo: Courtesy of Seth Granville on flickr
© 2025 Benzinga.com. Benzinga does not provide investment advice. All rights reserved.
Trade confidently with insights and alerts from analyst ratings, free reports and breaking news that affects the stocks you care about.