
Zinger Key Points
- American Airlines was trading lower Thursday, despite printing better-than-expected third-quarter earnings.
- The stock could be settling into a bull flag pattern, with a measured move of about 20%.
- Our government trade tracker caught Pelosi’s 169% AI winner. Discover how to track all 535 Congress member stock trades today.
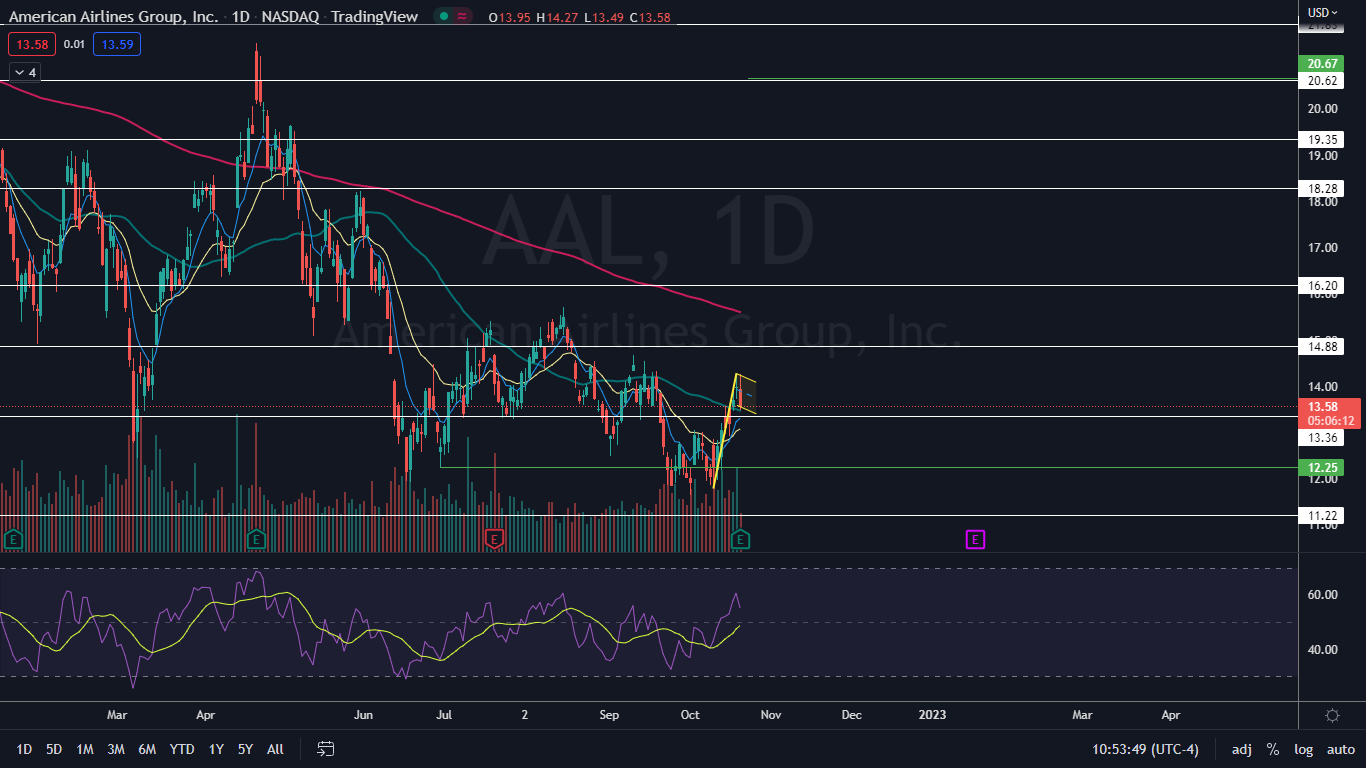
American Airlines Group, Inc AAL was sliding about 2.5% lower on Thursday despite printing a third-quarter earnings beat.
For the third quarter, American Airlines reported revenue of $13.46 billion, which beat the $13.25-billion consensus estimate. The company reported earnings per share of 69 cents, beating a consensus estimate of 31 cents. Revenue was up 50.1% year-over-year.
Despite the general markets moving slightly higher intraday, American Airlines was unable to break above Wednesday’s high-of-day, which prompted selling pressure to come in. If the stock is able to hold above $13.30, the recent downturn could be part of American Airlines working to print a bull flag pattern.
The bull flag pattern is created with a sharp rise higher forming the pole, which is then followed by a consolidation pattern that brings the stock lower between a channel with parallel lines or into a tightening triangle pattern.
For bearish traders, the "trend is your friend" (until it's not) and the stock may continue downward within the following channel for a short period of time. Aggressive traders may decide to short the stock at the upper trendline and exit the trade at the lower trendline.
- Bullish traders will want to watch for a break up from the upper descending trendline of the flag formation, on high volume, for an entry. When a stock breaks up from a bull flag pattern, the measured move higher is equal to the length of the pole and should be added to the lowest price within the flag.
- A bull flag is negated when a stock closes a trading day below the lower trendline of the flag pattern or if the flag falls more than 50% down the length of the pole.
Want direct analysis? Find me in the BZ Pro lounge! Click here for a free trial.
The American Airlines Chart: American Airlines reversed course into an uptrend on Oct. 12, rising almost 20% between that date and Wednesday, when the stock topped out at the $14.28 mark. The rise, paired with Thursday’s decline, could be setting American Airlines into a bull flag pattern.
- If American Airlines is able to hold above the $13.30 level, where the eight-day exponential moving average (EMA) is trending, the bull flag will remain intact. On Thursday, the 50-day simple moving average was acting as support, which is a good sign for the bulls.
- Bullish traders want to see American Airlines continue to consolidate slightly lower or sideways on low volume and then for the stock to break up from the upper descending trendline of the flag on higher-than-average volume. If that occurs, the measured move could take the stock to the $16 mark.
- Bearish traders want to see increasing bearish volume drop the stock down below the eight-day EMA, which will negate the bull flag. Although the bull flag would be negated in that case, American Airlines could also print a higher low, to indicate an uptrend pattern is in play.
- American Airlines has resistance above at $14.88 and $16.20 and support below at $13.36 and $11.22.
 See Also: Why American Airlines And Delta Air Lines Shares Are Rising After United Airlines Earnings Report
Photo via Shutterstock.
© 2025 Benzinga.com. Benzinga does not provide investment advice. All rights reserved.
Trade confidently with insights and alerts from analyst ratings, free reports and breaking news that affects the stocks you care about.

