Amazon.com, Inc AMZN was trading about 1.7% lower in the premarket Friday, in sympathy with the S&P 500, which was falling 0.8%
The e-commerce and streaming giant is facing a 900-million-pound ($1.01 billion) U.K. antitrust class action lawsuit for allegedly using an algorithm that favors products sold directly by Amazon or by third-party retailers who pay large fees to Amazon.
The lawsuit, which is likely to be filed before the end of October, alleges that Amazon has breached competition law and caused millions of U.K. customers to pay higher prices for products sold on Amazon.co.uk.
Amazon’s price didn’t reflect on Thursday that traders and investors are concerned about the class action, and the stock’s volume was measuring in below average, which indicates lower-than-average interest in Amazon.
Want direct analysis? Find me in the BZ Pro lounge! Click here for a free trial.
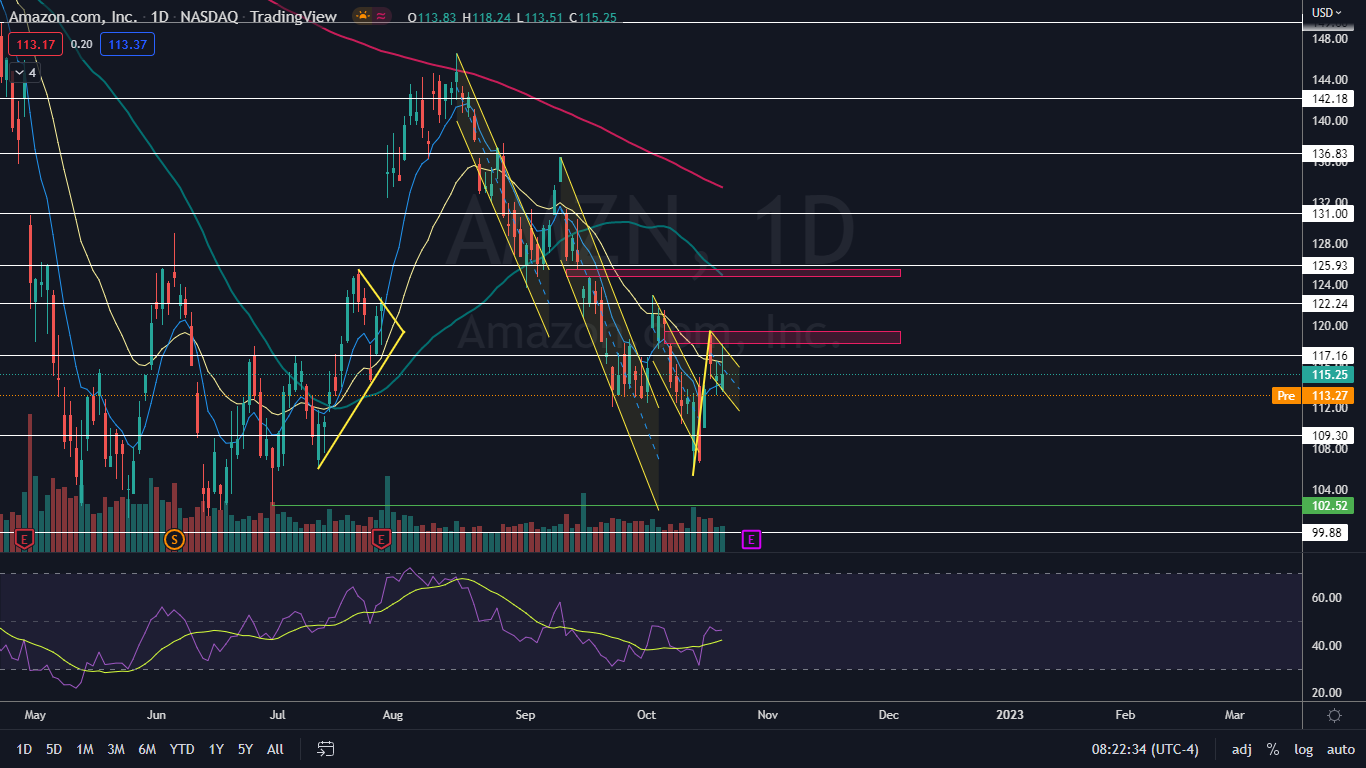
The Amazon Chart: Amazon broke up bullishly from a falling channel pattern on Tuesday, to close an upper gap between $118.17 and $119.50, which was left behind on Sept. 16. The stock rejected the upper range of the gap and ran into a group of sellers, which has caused Amazon to consolidate lower over the last two trading days.
- The break up from the falling channel, paired with the slightly lower price on Wednesday, caused Amazon to print a higher low to negate its downtrend. If an uptrend is about to take place, bullish traders will want to see Amazon print a higher high above $120 over the next few trading days.
- Amazon could be forming a bull flag pattern on the daily chart, with the pole created between Oct. 13 and Oct. 18 and the flag beginning to form over the trading days that have followed.
- If Amazon breaks up from the upper descending trendline of the flag on higher-than-average volume, the measured move indicates the stock could soar up toward $128.
- If Amazon fails to print a higher high and break up from the bull flag, a tightening pattern such as a triangle may occur. If that happens, traders can watch for the stock to break up or down from the triangle on higher-than-average volume to indicate the possible future direction.
- If Amazon closes Friday's session under the eight-day exponential moving average, the bull flag pattern will be negated.
- Amazon has resistance above at $117.16 and $122.24 and support below at $109.30 and $99.88.
 See Also: Amazon, Snap And 2 Other Stocks Insiders Are Selling
Photo via Shutterstock.
© 2024 Benzinga.com. Benzinga does not provide investment advice. All rights reserved.
Comments
Trade confidently with insights and alerts from analyst ratings, free reports and breaking news that affects the stocks you care about.