


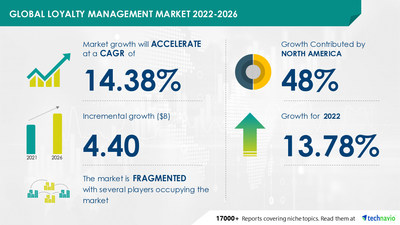
NEW YORK, Oct. 24, 2022 /PRNewswire/ -- The Loyalty Management Market report has been added to Technavio's offering. With ISO 9001:2015 certification, Technavio is proudly partnering with more than 100 Fortune 500 companies for over 16 years. The potential growth difference for the loyalty management market between 2021 and 2026 is USD 4.40 billion. The market will accelerate at a CAGR of 14.38% with an estimated growth rate of 13.78% Y-O-Y in 2022. Request Free Sample Report.

One of the main factors propelling the growth of the loyalty management market is the increasing customer inclination for tailored solutions. Over the past few decades, customer loyalty programs have undergone numerous changes. Today's consumers not only expect to be instantly rewarded for shopping at their favorite brands and to be able to use their rewards right away at the point of sale, but they also expect optimal engagement with brands both before and after the purchase through their brand communication channel.
In the past, customers needed to visit a single local store several times to feel like they were being rewarded for shopping in the same place. Because they increase sales, customer loyalty, online traffic, and profits, retailers also favor customized reward programs. All of these elements are projected to accelerate the growth of the market during the forecast period. Buy Sample Report.
One of the things preventing the growth of the loyalty management market is the strict government restrictions that may limit the use of loyalty programs. Under the GDPR, the definition of personal data, permission, partners, enterprise communication, and statistics withdrawal are the essential variables that have an impact on businesses' loyalty programs. Companies adopting safety data protection rules are crucial when it comes to compliance due to the significant risk of suffering penalties that are detrimental to their income.
The adoption of loyalty programs is generally constrained by worries about various federal and state rules such as gift certificate laws, trade stamp laws, data security laws, and privacy laws. Because of this, the banking sector is prevented from restructuring its incentive system, which impacts the market as a whole. Download Free Sample Report.
The market for cloud-based loyalty management software is anticipated to expand quickly over the course of the forecast period. This development can be credited to the capability of cloud-based loyalty management solutions to collect, store, and provide data from a single point of access. Mobile phones, social media, tablets, and many other user-friendly gadgets are all available through the cloud-based deployment method. As cell phones and the Internet become more widely used, so is the demand for cloud-based loyalty management software.
These mobile applicant monitoring apps are often cloud-based and can run on iOS and Android devices. Thus, the use of smartphones and the web doubles the demand for cloud-based loyalty management software. Moreover, cloud-based loyalty management software does not require any initial setup or infrastructure to be deployed in an organization or institution and organizations can update their systems based on their subscription plans. These factors will drive the growth of the segment.
Get lifetime access to our Technavio Insights! Subscribe to our "Basic Plan" billed annually at USD 5000.
Supply Chain Management Software Market by Application, Deployment, and Geography - Forecast and Analysis 2022-2026: The report extensively covers supply chain management software market segmentation by application (SCP, procurement, WMS, and TMS), deployment (on-premise and cloud-based), and geography (North America, Europe, APAC, Middle East and Africa, and South America).
Blockchain Technology Market in BFSI Sector by Type and Geography - Forecast and Analysis 2022-2026: The report extensively covers blockchain technology market segmentation in the BFSI sector by type (public blockchain, private blockchain, and consortium blockchain) and geography (North America, Europe, APAC, South America, and MEA).
Loyalty Management Market Scope | |
Report Coverage | Details |
Page number | 120 |
Base year | 2021 |
Forecast period | 2022-2026 |
Growth momentum & CAGR | Accelerate at a CAGR of 14.38% |
Market growth 2022-2026 | $4.40 billion |
Market structure | Fragmented |
YoY growth (%) | 13.78 |
Regional analysis | North America, Europe, APAC, South America, and Middle East and Africa |
Performing market contribution | North America at 48% |
Key consumer countries | US, China, Japan, UK, and Germany |
Competitive landscape | Leading companies, competitive strategies, consumer engagement scope |
Companies profiled | Aimia Inc., Bond Brand Loyalty, Brierley and Partners Inc., Capillary Technologies, Cheetah Digital Inc., Comarch SA, Epsilon Data Management LLC, Five Stars Loyalty Inc., ICF International Inc., Kobie, Maritz Motivation Inc., Merkle Inc., Oracle Corp., Punchh Inc., SAP SE, SessionM, Social Annex Inc., The Lacek Group, LoyaltyLion Ltd, and Apex Loyalty |
Market Dynamics | Parent market analysis, Market growth inducers and obstacles, Fast-growing and slow-growing segment analysis, COVID-19 impact and future consumer dynamics, and market condition analysis for the forecast period. |
Customization purview | If our report has not included the data that you are looking for, you can reach out to our analysts and get segments customized. |
1 Executive Summary
- 1.1 Market Overview
- Exhibit 01: Executive Summary – Chart on Market Overview
- Exhibit 02: Executive Summary – Data Table on Market Overview
- Exhibit 03: Executive Summary – Chart on Global Market Characteristics
- Exhibit 04: Executive Summary – Chart on Market by Geography
- Exhibit 05: Executive Summary – Chart on Market Segmentation by Deployment
- Exhibit 06: Executive Summary – Chart on Incremental Growth
- Exhibit 07: Executive Summary – Data Table on Incremental Growth
- Exhibit 08: Executive Summary – Chart on Vendor Market Positioning
2 Market Landscape
- 2.1 Market ecosystem
- Exhibit 09: Parent market
- Exhibit 10: Market Characteristics
3 Market Sizing
- 3.1 Market definition
- Exhibit 11: Offerings of vendors included in the market definition
- 3.2 Market segment analysis
- Exhibit 12: Market segments
- 3.3 Market size 2021
- 3.4 Market outlook: Forecast for 2021-2026
- Exhibit 13: Chart on Global - Market size and forecast 2021-2026 ($ million)
- Exhibit 14: Data Table on Global - Market size and forecast 2021-2026 ($ million)
- Exhibit 15: Chart on Global Market: Year-over-year growth 2021-2026 (%)
- Exhibit 16: Data Table on Global Market: Year-over-year growth 2021-2026 (%)
4 Five Forces Analysis
- 4.1 Five forces summary
- Exhibit 17: Five forces analysis - Comparison between 2021 and 2026
- 4.2 Bargaining power of buyers
- Exhibit 18: Chart on Bargaining power of buyers – Impact of key factors 2021 and 2026
- 4.3 Bargaining power of suppliers
- Exhibit 19: Bargaining power of suppliers – Impact of key factors in 2021 and 2026
- 4.4 Threat of new entrants
- Exhibit 20: Threat of new entrants – Impact of key factors in 2021 and 2026
- 4.5 Threat of substitutes
- Exhibit 21: Threat of substitutes – Impact of key factors in 2021 and 2026
- 4.6 Threat of rivalry
- Exhibit 22: Threat of rivalry – Impact of key factors in 2021 and 2026
- 4.7 Market condition
- Exhibit 23: Chart on Market condition - Five forces 2021 and 2026
5 Market Segmentation by Deployment
- 5.1 Market segments
- Exhibit 24: Chart on Deployment - Market share 2021-2026 (%)
- Exhibit 25: Data Table on Deployment - Market share 2021-2026 (%)
- 5.2 Comparison by Deployment
- Exhibit 26: Chart on Comparison by Deployment
- Exhibit 27: Data Table on Comparison by Deployment
- 5.3 Cloud-based - Market size and forecast 2021-2026
- Exhibit 28: Chart on Cloud-based - Market size and forecast 2021-2026 ($ million)
- Exhibit 29: Data Table on Cloud-based - Market size and forecast 2021-2026 ($ million)
- Exhibit 30: Chart on Cloud-based - Year-over-year growth 2021-2026 (%)
- Exhibit 31: Data Table on Cloud-based - Year-over-year growth 2021-2026 (%)
- 5.4 On-premise - Market size and forecast 2021-2026
- Exhibit 32: Chart on On-premise - Market size and forecast 2021-2026 ($ million)
- Exhibit 33: Data Table on On-premise - Market size and forecast 2021-2026 ($ million)
- Exhibit 34: Chart on On-premise - Year-over-year growth 2021-2026 (%)
- Exhibit 35: Data Table on On-premise - Year-over-year growth 2021-2026 (%)
- 5.5 Market opportunity by Deployment
- Exhibit 36: Market opportunity by Deployment ($ million)
6 Customer Landscape
- 6.1 Customer landscape overview
- Exhibit 37: Analysis of price sensitivity, lifecycle, customer purchase basket, adoption rates, and purchase criteria
7 Geographic Landscape
- 7.1 Geographic segmentation
- Exhibit 38: Chart on Market share by geography 2021-2026 (%)
- Exhibit 39: Data Table on Market share by geography 2021-2026 (%)
- 7.2 Geographic comparison
- Exhibit 40: Chart on Geographic comparison
- Exhibit 41: Data Table on Geographic comparison
- 7.3 North America - Market size and forecast 2021-2026
- Exhibit 42: Chart on North America - Market size and forecast 2021-2026 ($ million)
- Exhibit 43: Data Table on North America - Market size and forecast 2021-2026 ($ million)
- Exhibit 44: Chart on North America - Year-over-year growth 2021-2026 (%)
- Exhibit 45: Data Table on North America - Year-over-year growth 2021-2026 (%)
- 7.4 Europe - Market size and forecast 2021-2026
- Exhibit 46: Chart on Europe - Market size and forecast 2021-2026 ($ million)
- Exhibit 47: Data Table on Europe - Market size and forecast 2021-2026 ($ million)
- Exhibit 48: Chart on Europe - Year-over-year growth 2021-2026 (%)
- Exhibit 49: Data Table on Europe - Year-over-year growth 2021-2026 (%)
- 7.5 APAC - Market size and forecast 2021-2026
- Exhibit 50: Chart on APAC - Market size and forecast 2021-2026 ($ million)
- Exhibit 51: Data Table on APAC - Market size and forecast 2021-2026 ($ million)
- Exhibit 52: Chart on APAC - Year-over-year growth 2021-2026 (%)
- Exhibit 53: Data Table on APAC - Year-over-year growth 2021-2026 (%)
- 7.6 South America - Market size and forecast 2021-2026
- Exhibit 54: Chart on South America - Market size and forecast 2021-2026 ($ million)
- Exhibit 55: Data Table on South America - Market size and forecast 2021-2026 ($ million)
- Exhibit 56: Chart on South America - Year-over-year growth 2021-2026 (%)
- Exhibit 57: Data Table on South America - Year-over-year growth 2021-2026 (%)
- 7.7 Middle East and Africa - Market size and forecast 2021-2026
- Exhibit 58: Chart on Middle East and Africa - Market size and forecast 2021-2026 ($ million)
- Exhibit 59: Data Table on Middle East and Africa - Market size and forecast 2021-2026 ($ million)
- Exhibit 60: Chart on Middle East and Africa - Year-over-year growth 2021-2026 (%)
- Exhibit 61: Data Table on Middle East and Africa - Year-over-year growth 2021-2026 (%)
- 7.8 US - Market size and forecast 2021-2026
- Exhibit 62: Chart on US - Market size and forecast 2021-2026 ($ million)
- Exhibit 63: Data Table on US - Market size and forecast 2021-2026 ($ million)
- Exhibit 64: Chart on US - Year-over-year growth 2021-2026 (%)
- Exhibit 65: Data Table on US - Year-over-year growth 2021-2026 (%)
- 7.9 UK - Market size and forecast 2021-2026
- Exhibit 66: Chart on UK - Market size and forecast 2021-2026 ($ million)
- Exhibit 67: Data Table on UK - Market size and forecast 2021-2026 ($ million)
- Exhibit 68: Chart on UK - Year-over-year growth 2021-2026 (%)
- Exhibit 69: Data Table on UK - Year-over-year growth 2021-2026 (%)
- 7.10 China - Market size and forecast 2021-2026
- Exhibit 70: Chart on China - Market size and forecast 2021-2026 ($ million)
- Exhibit 71: Data Table on China - Market size and forecast 2021-2026 ($ million)
- Exhibit 72: Chart on China - Year-over-year growth 2021-2026 (%)
- Exhibit 73: Data Table on China - Year-over-year growth 2021-2026 (%)
- 7.11 Germany - Market size and forecast 2021-2026
- Exhibit 74: Chart on Germany - Market size and forecast 2021-2026 ($ million)
- Exhibit 75: Data Table on Germany - Market size and forecast 2021-2026 ($ million)
- Exhibit 76: Chart on Germany - Year-over-year growth 2021-2026 (%)
- Exhibit 77: Data Table on Germany - Year-over-year growth 2021-2026 (%)
- 7.12 Japan - Market size and forecast 2021-2026
- Exhibit 78: Chart on Japan - Market size and forecast 2021-2026 ($ million)
- Exhibit 79: Data Table on Japan - Market size and forecast 2021-2026 ($ million)
- Exhibit 80: Chart on Japan - Year-over-year growth 2021-2026 (%)
- Exhibit 81: Data Table on Japan - Year-over-year growth 2021-2026 (%)
- 7.13 Market opportunity by geography
- Exhibit 82: Market opportunity by geography ($ million)
8 Drivers, Challenges, and Trends
- 8.1 Market drivers
- 8.2 Market challenges
- 8.3 Impact of drivers and challenges
- Exhibit 83: Impact of drivers and challenges in 2021 and 2026
- 8.4 Market trends
9 Vendor Landscape
- 9.1 Overview
- 9.2 Vendor landscape
- Exhibit 84: Overview on Criticality of inputs and Factors of differentiation
- 9.3 Landscape disruption
- Exhibit 85: Overview on factors of disruption
- 9.4 Industry risks
- Exhibit 86: Impact of key risks on business
10 Vendor Analysis
- 10.1 Vendors covered
- Exhibit 87: Vendors covered
- 10.2 Market positioning of vendors
- Exhibit 88: Matrix on vendor position and classification
- 10.3 Aimia Inc.
- Exhibit 89: Aimia Inc. - Overview
- Exhibit 90: Aimia Inc. - Product / Service
- Exhibit 91: Aimia Inc. - Key offerings
- 10.4 Bond Brand Loyalty
- Exhibit 92: Bond Brand Loyalty - Overview
- Exhibit 93: Bond Brand Loyalty - Product / Service
- Exhibit 94: Bond Brand Loyalty - Key offerings
- 10.5 Brierley and Partners Inc.
- Exhibit 95: Brierley and Partners Inc. - Overview
- Exhibit 96: Brierley and Partners Inc. - Product / Service
- Exhibit 97: Brierley and Partners Inc. - Key offerings
- 10.6 Comarch SA
- Exhibit 98: Comarch SA - Overview
- Exhibit 99: Comarch SA - Product / Service
- Exhibit 100: Comarch SA - Key offerings
- 10.7 Epsilon Data Management LLC
- Exhibit 101: Epsilon Data Management LLC - Overview
- Exhibit 102: Epsilon Data Management LLC - Product / Service
- Exhibit 103: Epsilon Data Management LLC - Key offerings
- 10.8 Five Stars Loyalty Inc.
- Exhibit 104: Five Stars Loyalty Inc. - Overview
- Exhibit 105: Five Stars Loyalty Inc. - Product / Service
- Exhibit 106: Five Stars Loyalty Inc. - Key offerings
- 10.9 ICF International Inc.
- Exhibit 107: ICF International Inc. - Overview
- Exhibit 108: ICF International Inc. - Product / Service
- Exhibit 109: ICF International Inc. - Key offerings
- 10.10 Oracle Corp.
- Exhibit 110: Oracle Corp. - Overview
- Exhibit 111: Oracle Corp. - Business segments
- Exhibit 112: Oracle Corp. - Key news
- Exhibit 113: Oracle Corp. - Key offerings
- Exhibit 114: Oracle Corp. - Segment focus
- 10.11 SAP SE
- Exhibit 115: SAP SE - Overview
- Exhibit 116: SAP SE - Business segments
- Exhibit 117: SAP SE - Key news
- Exhibit 118: SAP SE - Key offerings
- Exhibit 119: SAP SE - Segment focus
- 10.12 The Lacek Group
- Exhibit 120: The Lacek Group - Overview
- Exhibit 121: The Lacek Group - Product / Service
- Exhibit 122: The Lacek Group - Key offerings
11 Appendix
- 11.1 Scope of the report
- 11.2 Inclusions and exclusions checklist
- Exhibit 123: Inclusions checklist
- Exhibit 124: Exclusions checklist
- 11.3 Currency conversion rates for US$
- Exhibit 125: Currency conversion rates for US$
- 11.4 Research methodology
- Exhibit 126: Research methodology
- Exhibit 127: Validation techniques employed for market sizing
- Exhibit 128: Information sources
- 11.5 List of abbreviations
- Exhibit 129: List of abbreviations
Technavio is a leading global technology research and advisory company. Their research and analysis focuses on emerging market trends and provides actionable insights to help businesses identify market opportunities and develop effective strategies to optimize their market positions.
With over 500 specialized analysts, Technavio's report library consists of more than 17,000 reports and counting, covering 800 technologies, spanning across 50 countries. Their client base consists of enterprises of all sizes, including more than 100 Fortune 500 companies. This growing client base relies on Technavio's comprehensive coverage, extensive research, and actionable market insights to identify opportunities in existing and potential markets and assess their competitive positions within changing market scenarios.
Contact
Technavio Research
Jesse Maida
Media & Marketing Executive
US: +1 844 364 1100
UK: +44 203 893 3200
Email:media@technavio.com
Website: www.technavio.com/


SOURCE Technavio
© 2024 Benzinga.com. Benzinga does not provide investment advice. All rights reserved.
Trade confidently with insights and alerts from analyst ratings, free reports and breaking news that affects the stocks you care about.

