


Zinger Key Points
- Analysts estimate Meta will print earnings per share of $1.91 on revenues of $27.53 billion.
- Facebook is trading in an uptrend, but if the earnings reaction is bearish, there is no recent support under $122.53
- Today's manic market swings are creating the perfect setup for Matt’s next volatility trade. Get his next trade alert for free, right here.
Meta Platforms, Inc META is set to print its fiscal third-quarter financial results after the market closes on Wednesday. The stock was trading over 5% lower heading into the event.
When the tech giant printed its second-quarter results on July 27, the stock closed the following day down about 5% but then reversed into an uptrend, rising 16% over the subsequent 10 trading days.
For the second quarter, Meta reported EPS of $2.46 on revenue of $28.82 billion. The company missed the EPS estimate of $2.61 and the estimate of $28.97 billion in revenues.
For the third quarter, analysts estimate Meta will print earnings per share of $1.91 on revenues of $27.53 billion.
Here's what to watch when Meta's earnings print after the bell.
Ahead of the event, KeyBanc analyst Justin Patterson maintained an Overweight rating on Meta and lowered the price target from $195 to $175. Jefferies analyst Brent Thill maintained a Buy rating on the stock and lowered the price target from $225 to $200.
From a technical analysis perspective, Meta’s stock looks set to trade higher over the coming days do to the confirmation of an uptrend, but it should be noted that holding stocks or options over an earnings print is akin to gambling because stocks can react bullishly to an earnings miss and bearishly to an earnings beat.
Options traders, particularly those who are holding close dated calls or puts, take on extra risk because the institutions writing the options increase premiums to account for implied volatility.
Want direct analysis? Find me in the BZ Pro lounge! Click here for a free trial.
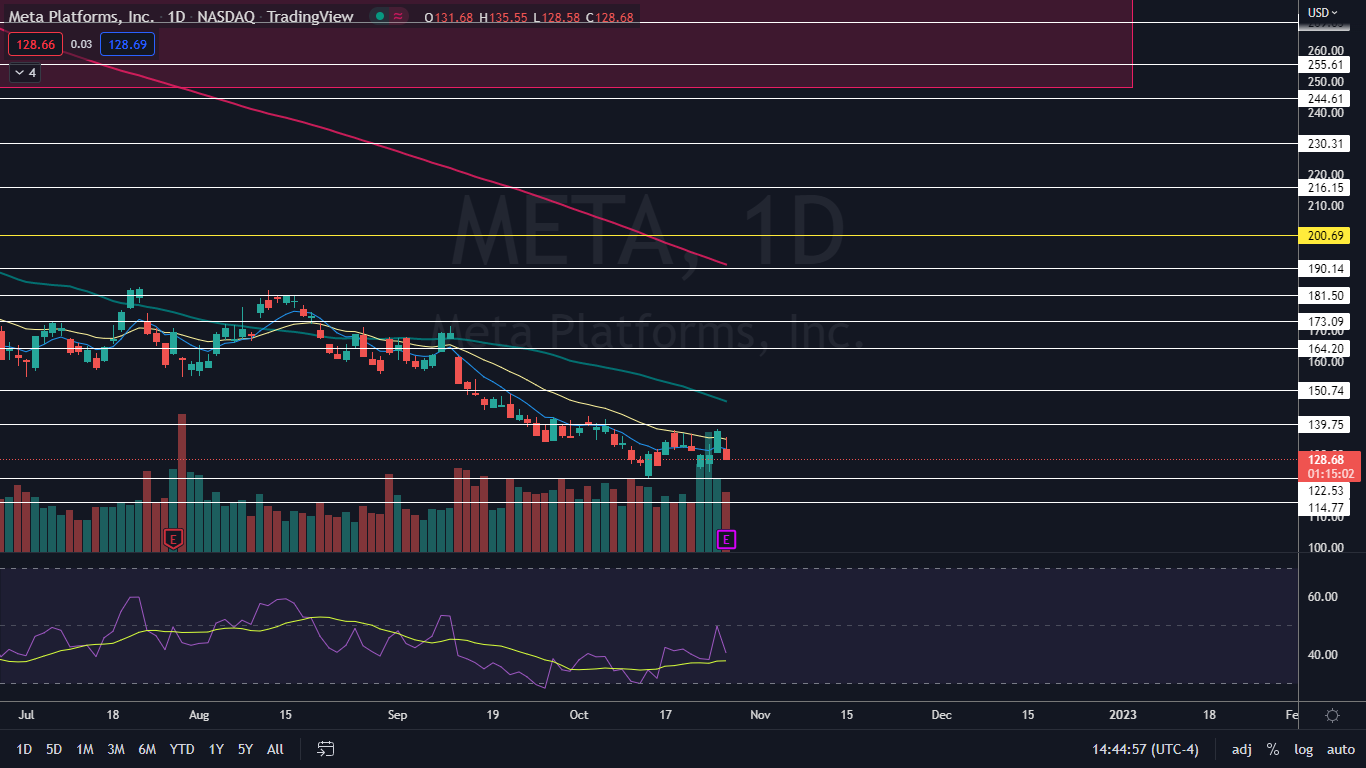
The Meta Chart: Meta opened with an inside bar on Wednesday to consolidate Tuesday’s 5% spike but by midafternoon the stock had broken down bearishly from the mother bar. The selling pressure began to increase because Meta opened under the 21-day exponential moving average and was unable to regain the level as support.
- Meta is trading in an uptrend, with the most recent higher high formed on Tuesday at $138.35 and the most recent confirmed higher low printed at the $124.57 mark the day prior.
- If the uptrend is set to continue, bullish traders will want to see Meta form a bullish reversal candlestick, such as a doji or hammer candlestick, above $125.
- The uptrend began on Oct. 13, when Meta reached its lowest level since Jan. 6, 2017 at $122.53. If Meta suffers a bearish reaction to its earnings print and falls under that level, a steep downtrend could occur because there is no recent support below the area.
- Meta has resistance above at $139.75 and $150.74 and support below at $122.53 and $114.77.
 See Also: Metaverse Is 'A Word I'll Never Use,' Apple Exec Says Echoing Snap Founder's Sentiment
Photo via Shutterstock.
Edge Rankings
Price Trend
© 2025 Benzinga.com. Benzinga does not provide investment advice. All rights reserved.
Trade confidently with insights and alerts from analyst ratings, free reports and breaking news that affects the stocks you care about.

