Zinger Key Points
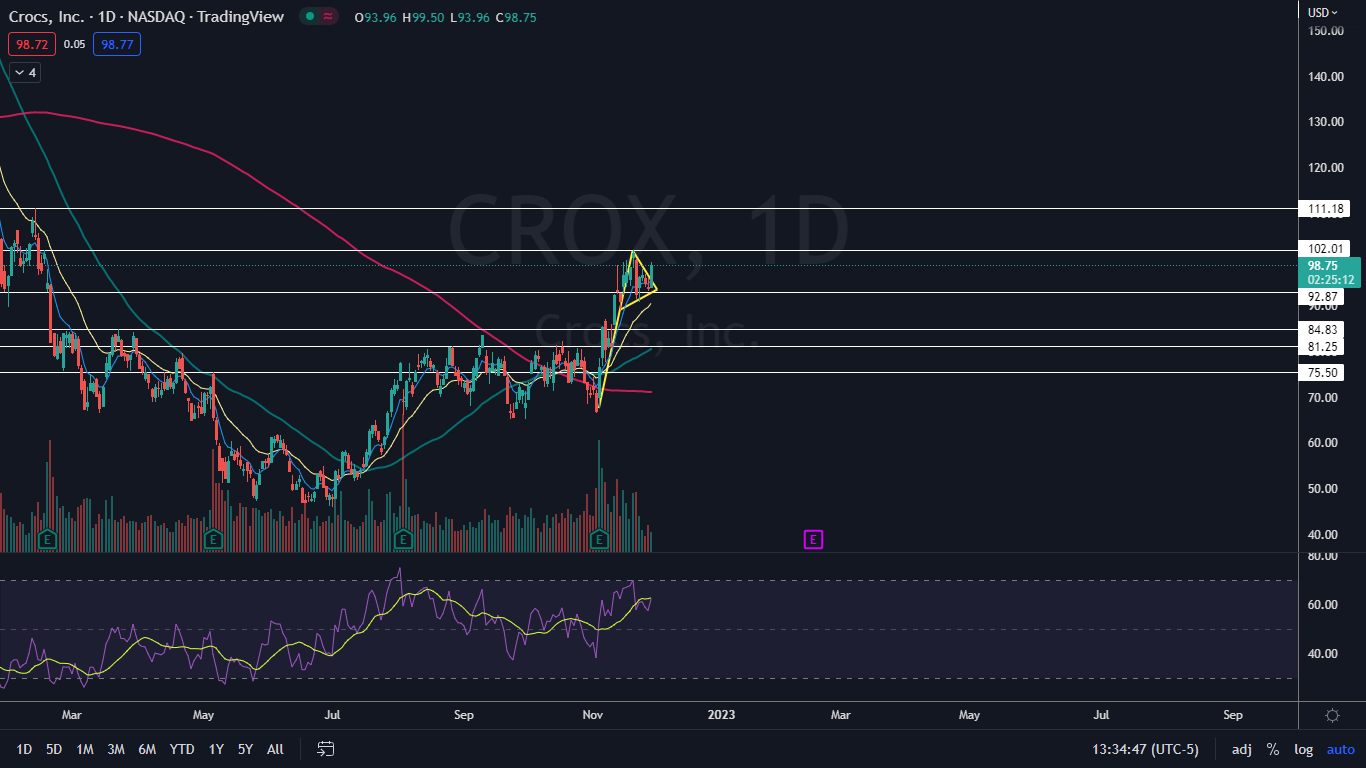
- Crocs was attempting to break up bullishly from a bull flag pattern that began forming on Nov. 3.
- Bullish traders want to see Crocs bust up through the $102 level to indicate the uptrend is intact.
- Next: Access Our New, Shockingly Simple 'Alert System'
Crocs, Inc CROX was spiking up over 5% higher on Tuesday, showing comparative strength to the general market, which saw the S&P 500 ticking slightly lower.
The upward momentum in Crocs was caused by the break up from a bull flag pattern. The bull flag pattern is created with a sharp rise higher forming the pole, which is then followed by a consolidation pattern that brings the stock lower between a channel with parallel lines or into a tightening triangle pattern.
- For bearish traders, the "trend is your friend" (until it's not) and the stock may continue downwards within the following channel for a short period of time. Aggressive traders may decide to short the stock at the upper trendline and exit the trade at the lower trendline.
- Related Link: People Are Dumping $1,000 Down Jackets, Picking Up Plastic Shoes With Holes, Leaving The $2,000 Exercise Bike Behind: What's Going On?
- Bullish traders will want to watch for a break up from the upper descending trendline of the flag formation, on high volume, for an entry. When a stock breaks up from a bull flag pattern, the measured move higher is equal to the length of the pole and should be added to the lowest price within the flag.
A bull flag is negated when a stock closes a trading day below the lower trendline of the flag pattern, or if the flag falls more than 50% down the length of the pole.
Want direct analysis? Find me in the BZ Pro lounge! Click here for a free trial.
The Crocs Chart: Crocs formed a bull flag between Nov. 3 and Monday, with the upward trending pole created over the first 12 trading days of that time frame and the flag formed over the subsequent trading days. On Tuesday, Crocs broke up from the flag pattern but on lower-than-average volume, which could indicate the pattern wasn’t recognized.
- The lower-than-average volume could also be caused by the downturn in the general markets, which could have Crocs bulls feeling less confident about seeing confirmation. If momentum comes into Crocs on Wednesday in the form of high bullish volume, the stock could eventually complete the measured move of the bull flag, which suggests Crocs could surge up toward $121.
- If Crocs trends higher on Wednesday in continuation, the stock may find psychological resistance at $100 and be forced to consolidate under the level. If Crocs breaks above $100 but is unable to burst through $102, a bearish double top pattern could form, which could indicate a retracement is in the cards.
- Bullish traders would like to see Crocs form a higher high above that level, which would indicate the current uptrend is intact. A golden cross, where the 50-day simple moving average (SMA) crossed above the 200-day SMA, formed on Oct. 13, which indicates the stock is currently enjoying a bull cycle.
- Bearish traders would like to see big bearish volume come in and drop Crocs down under the $91 level, which would negate the uptrend and indicate a downtrend could be on the horizon.
- Crocs has resistance above at $102.01 and $111.18 and support below at $92.87 and $84.83.

See Also: TJX, Walmart And 2 Other Stocks Insiders Are Selling
© 2025 Benzinga.com. Benzinga does not provide investment advice. All rights reserved.
Trade confidently with insights and alerts from analyst ratings, free reports and breaking news that affects the stocks you care about.