Zinger Key Points
- The Dow Jones confirmed a bull market on Nov. 10 but the S&P 500 hasn't yet confirmed the bear market is over.
- A bull market takes place when a stock or ETF rebounds 20% from the lows and regains the 200-day SMA as support.
- Join Chris Capre on Sunday at 1 PM ET to learn the short-term trading strategy built for chaotic, tariff-driven markets—and how to spot fast-moving setups in real time.
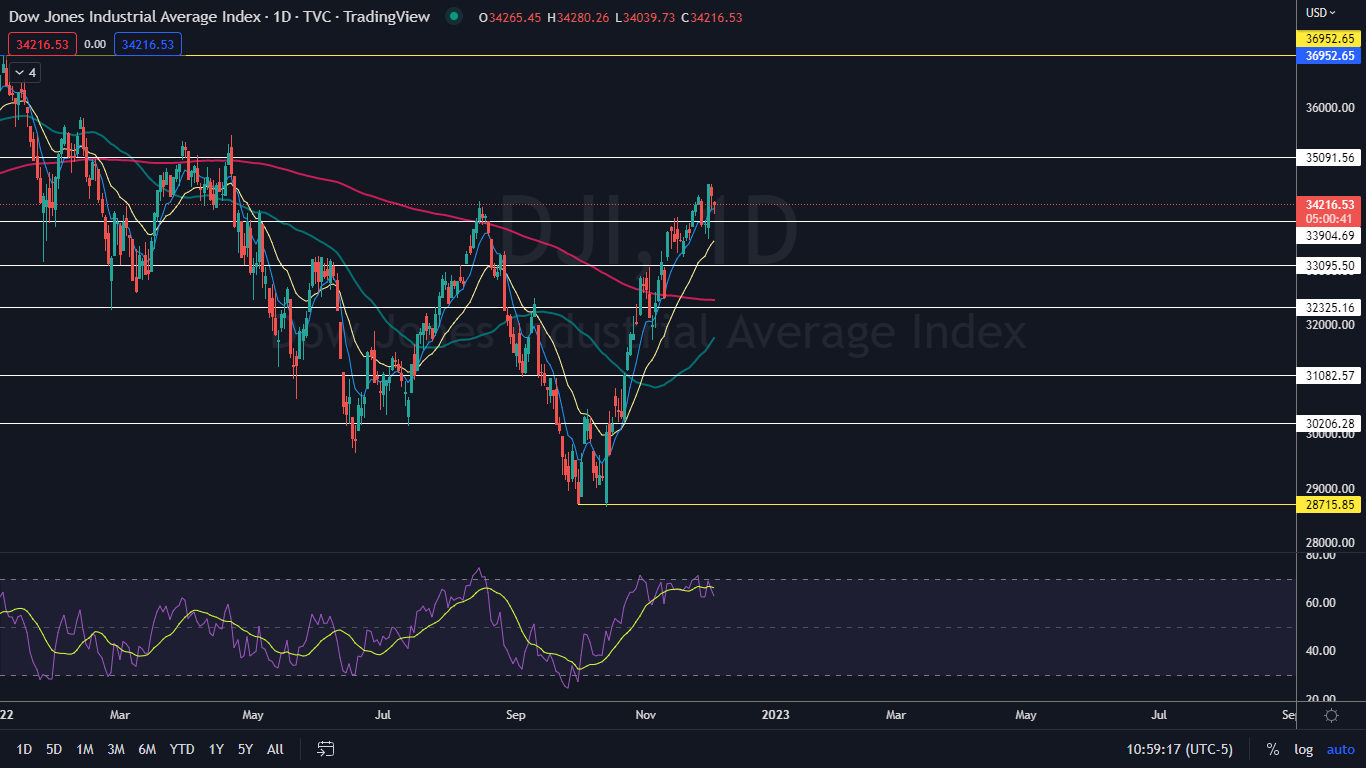
The Dow Jones Industrial Average index has surged about 20% since Oct. 13 after printing a double bottom pattern near the $28,700 mark and forming a V-shaped reversal.
Although the S&P 500 has rebounded 15% since that same date, it hasn’t been able to prove the recent bear market is over, whereas the Dow entered into a confirmed bull cycle on Nov. 10.
Whether or not the Dow’s bull cycle suggests the overall bear market will come to an end has yet to be seen, but with the Dow trading 5% above the 200-day simple moving average, bullish sentiment is slowly returning to the general market.
See Also: 'Eye-Popping For The Fed': 5 Experts React To November Jobs Report, What It Means For Interest Rates
What Happened: In late 2021, soaring inflation, combined with a steep series of interest rate hikes beginning in the spring of 2022, caused investors to fear the U.S. could be thrown into a recession.
Because the stock market is forward-looking, the S&P 500 began to anticipate an economic downturn at the beginning of January and officially fell into a bear market on June 13. The Dow didn’t officially plunge 20% until Sept. 13, although the index came close on June 17, when the Dow had fallen a total of 19.75% off its Jan. 5 all-time high of 36,952.65.
When the Fed suggested on Wednesday the central bank could begin easing back on its interest rate hikes starting as early as next month, the S&P 500 recaptured the 200-day SMA as support.
On Friday, when the Labour Department reported strong U.S. job numbers, however, fear that the Fed’s policy is failing to slow the economy returned, causing the SPY to fall under the 200-day.
Bear Markets: A bear market occurs when a major stock market index falls more than 20% from its most recent high. During a bear market, stocks and major indices move in long-term downtrends with short-term bounces.
Bear markets can accompany recessions but bear markets can also take place without a major economic downturn.
Fear, pessimism and negative sentiment coincide with a bear market because many traders have a natural tendency to be bullish.
Retail traders and investors tend to have a bullish bias because holding shares of a company is the easiest way to invest, and the only way to profit from holding shares long is when the market moves higher.
More advanced traders and investors can make a profit in a bearish stock market by selling shares short or by purchasing put options.
For technical traders, bear markets are often preceded by a death cross developing on a stock or ETF’s chart, where the 50-day simple moving average (SMA) crossed below the 200-day SMA. During a bear market, a stock or major index trades under the 200-day SMA and the indictor trends south.
Bull Markets: A bull market is generally defined by a stock or major index rebounding 20% from the low.
Bull markets take place far more often than bear markets and are categorized by extended periods of growth, where the stock market, overall, trends upwards despite short periods of downward price action.
During bull markets, investors can use a buy-and-hold strategy on their investments and traders can scalp and swing shares or purchase call options.
For technical traders, bull markets are more difficult to predict because a golden cross, which is the opposite of a death cross, doesn’t occur on a chart until after the new cycle begins.
Generally speaking, a bull market can be predicted using technical analysis when a security regains the 200-day SMA as support and trends higher above the indicator for a period of time.
Want direct analysis? Find me in the BZ Pro lounge! Click here for a free trial.
The Dow Chart

Read Next: Will Santa Claus Visit The Stock Market This Year? The History Of Holiday Rallies
Photo: Javen via Shutterstock
Edge Rankings
Price Trend
© 2025 Benzinga.com. Benzinga does not provide investment advice. All rights reserved.
Trade confidently with insights and alerts from analyst ratings, free reports and breaking news that affects the stocks you care about.