Zinger Key Points
- "Apple's got the worst chart in the book, a lot of people are saying that Apple's finished," Cramer said.
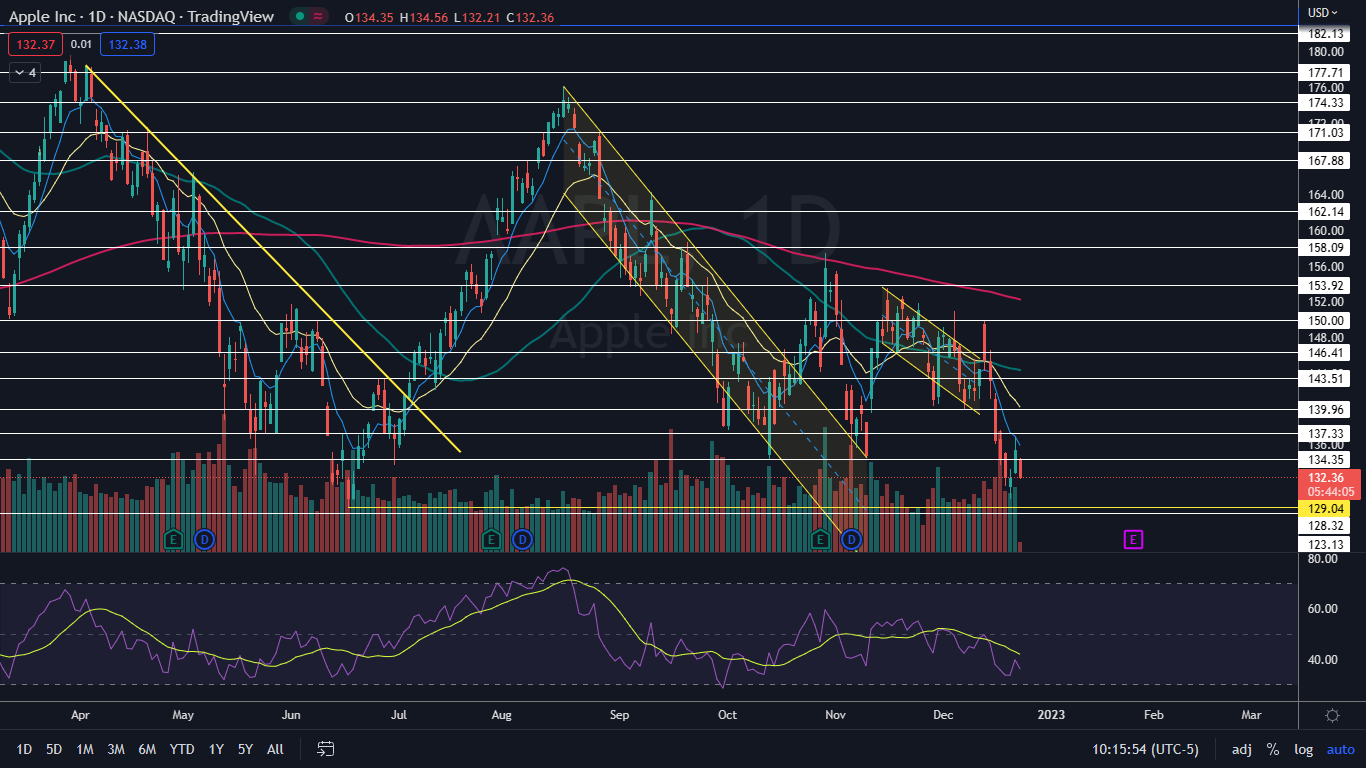
- Apple is trading in a confirmed downtrend, but paired with price action on June 16, may have formed a double bottom pattern.
- Get the Real Story Behind Every Major Earnings Report
Apple, Inc AAPL was sliding lower Thursday in tandem with the S&P 500, which was declining after initial jobless claims came in lower than expected.
Initial jobless claims came in at 216,000, up from 214,000 the week prior but well below the 222,000 estimate. The data indicates the Federal Reserve’s policy isn’t slowing the economy as effectively as many traders and investors hoped.
Like many tech stocks, Apple declined this year, plunging about 25% from the Jan. 3 opening price of $177.71 to trade near the $133 level.
Growth stocks have been negatively impacted by soaring inflation and steeply rising interest rates, which caused consumers to tighten their spending.
In comparison to Amazon.com, Inc AMZN and Tesla, Inc TSLA, Apple has shown strength, with Amazon down about 50% from Jan. 3 and Tesla a total of over 65%.
Despite the comparative strength, Jim Cramer isn’t a fan of Apple and on CNBC’s “Squawk On The Street” on Wednesday, Cramer took aim at the stock’s chart.
"There's been no let up in the selling of anything FANG. It's just horrendous. I don't think it's going to let up because I think it's a great source of funds for everything else. Apple's got the worst chart in the book, a lot of people are saying that Apple's finished," Cramer said.
"The chartists are saying that this is, again, the single worst chart they've ever seen," he added.
While Apple’s chart isn’t particularly bullish, there are signals traders can watch over the next few days for a sign the temporary bottom could be in, with at least a short-term rally on the horizon.
Want direct analysis? Find me in the BZ Pro lounge! Click here for a free trial.
The Apple Chart: On Tuesday, Apple fell to the June 16 low near the $129 level and bounced up from the area, creating a bullish double bottom pattern. On Wednesday, Apple began to react to the pattern, rallying over 2%.
- On Thursday, Apple opened with an inside bar pattern but the bears quickly came in and dropped the stock down under Wednesday’s low-of-day. This indicates the bears are still in control.
- The bulls want to see Apple print a higher low above $129 later Thursday or on Friday. Bullish traders can watch for Apple to print a bullish reversal candlestick, such as a doji or hammer candlestick, to signal a possible higher low.
- Bearish traders want to see confirmation that Wednesday’s high-of-day is the next higher low within Apple’s downtrend pattern. If it is, Apple is likely to slide under Tuesday’s low-of-day, which will cause the stock to print a new 52-week low.
 Read Next: iPhone 14 Was No Match For This Smartphone In Marques Brownlee's Blind Camera Test
Photo via Shutterstock.
© 2025 Benzinga.com. Benzinga does not provide investment advice. All rights reserved.
Trade confidently with insights and alerts from analyst ratings, free reports and breaking news that affects the stocks you care about.