The Consumer Discretionary sector ranks seventh out of the ten sectors as detailed in my Sector Rankings for ETFs and Mutual Funds. It gets my Neutral rating, which is based on aggregation of ratings of 17 ETFs and 27 mutual funds in the Consumer Discretionary sector as of October 10, 2012. Prior reports on the best & worst ETFs and mutual funds in every sector and style are here.
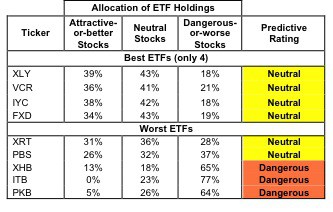
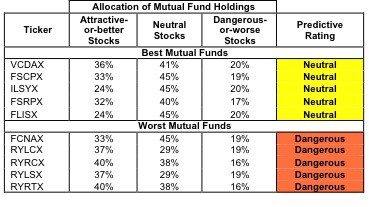
Figure 1 ranks from best to worst the nine Consumer Discretionary ETFs that meet our liquidity standards and Figure 2 shows the five best and worst-rated Consumer Discretionary mutual funds. Not all Consumer Discretionary sector ETFs and mutual funds are created the same. The number of holdings varies widely (from 25 to 372), which creates drastically different investment implications and ratings. The best ETFs and mutual funds allocate more value to Attractive-or-better-rated stocks than the worst ETFs and mutual funds, which allocate too much value to Neutral-or-worse-rated stocks.
To identify the best and avoid the worst ETFs and mutual funds within the Consumer Discretionary sector, investors need a predictive rating based on (1) stocks ratings of the holdings and (2) the all-in expenses of each ETF and mutual fund. Investors need not rely on backward-looking ratings. My fund rating methodology is detailed here.
Investors should not buy any Consumer Discretionary ETFs or mutual funds because none get an Attractive-or-better rating. If you must have exposure to this sector, you should buy a basket of Attractive-or-better rated stocks and avoid paying undeserved fund fees. Active management has a long history of not paying off.
Get my ratings on all ETFs and mutual funds in this sector on my free mutual fund and ETF screener.
Figure 1: ETFs with the Best & Worst Ratings
* Best ETFs exclude ETFs with TNA’s less than $100 million for inadequate liquidity.
Sources: New Constructs, LLC and company filings
Rydex S&P Equal Weight Consumer Discretionary RCD, PowerShares Dynamic Consumer Discretionary PEZ, and Market Vectors Retail ETF RTH are excluded from Figure 1 because their total net assets (TNA) are below $100 million and do not meet our liquidity standards.
Figure 2: Mutual Funds with the Best & Worst Ratings – Top 5
* Best mutual funds exclude funds with TNA’s less than $100 million for inadequate liquidity.
Sources: New Constructs, LLC and company filings
ICON Funds: ICON Consumer Discretionary Fund ICCCX and Fidelity Advisor Series VII: Fidelity Advisor Consumer Discretionary Fund (FCNIX) are excluded from Figure 2 because their total net assets (TNA) are below $100 million and do not meet our liquidity standards.
Consumer Discretionary Select Sector SPDR XLY is my top-rated Consumer Discretionary ETF and Vanguard World Funds: Vanguard Consumer Discretionary Index Fund VCDAX is my top-rated Consumer Discretionary mutual fund. Both earn my Neutral rating.
PowerShares Dynamic Build & Construction PKB is my worst-rated Consumer Discretionary ETF and Rydex Series Funds: Retailing Fund (RYRTX) is my worst-rated Consumer Discretionary mutual fund. Both earn my Dangerous rating.
Figure 3 shows that 122 out of the 450 stocks (about 28% of the total net assets) held by Consumer Discretionary ETFs and mutual funds get an Attractive-or-better rating. However, not a single Consumer Discretionary ETF or mutual fund earns an Attractive-or-better rating. The reason is that the majority (about 72%) of assets held by Consumer Discretionary ETFs and mutual funds is allocated to Neutral or Dangerous-rated stocks.
The takeaways is: mutual fund managers allocate too much capital to low-quality stocks and Consumer Discretionary ETFs hold poor quality stocks.
Figure 3: Consumer Discretionary Sector Landscape For ETFs, Mutual Funds & Stocks
As detailed in “Cheap Funds Dupe Investors”, the fund industry offers many cheap funds but very few funds with high-quality stocks, or with what I call good portfolio management.
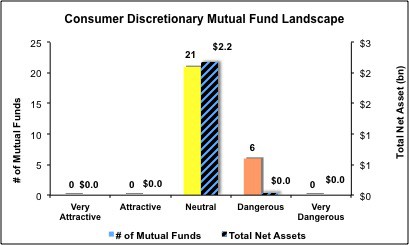
Investors need to tread carefully when considering Consumer Discretionary ETFs and mutual funds, because not a single one is rated Attractive or better. As you can see in Figure 3, 98% of assets invested in Consumer Discretionary mutual funds are held in Neutral-rated funds, and only 2% are in Dangerous funds. Investors have therefore done well to avoid the worst of the Consumer Discretionary mutual funds. However, even a Neutral-rated fund exposes investors to unattractive stocks, as well as the fees charged by active management. Why pay a manager to select unattractive stocks? Investors should not buy any Consumer Discretionary ETFs or mutual funds and instead should focus on owning a basket of Attractive-or-better-rated stocks.
Ford Motors F is a great example of an Attractive-or-better-rated Consumer Discretionary stock.Iit earns my Very Attractive rating. Let’s make no mistake about it, the American auto industry went through the ringer during the financial crisis, but Ford was better positioned than its rivals and emerged from the fracas as the clear leader of the American auto pack. Ford is ahead of it peers in increasing operational efficiency, closing outdated factories, and cutting-edge design and engineering. The result is a line of cars and trucks that is not only meeting consumer’s demands and generating profits for the company.Ford is now more profitable than ever. During the period 2004-2009, Ford’s average return on invested capital was a value-destroying -.85%. In 2010 Ford earned 11.6% ROIC and followed that up with 12.6% in 2011. This is a company that took advantage of a downturn to focus on capital stewardship, efficiency, and profitability. Best of all, the market has not caught on to Ford’s new value-generating engine. The current valuation as of 10/10/12, $10.10/share, implies that Ford’s profits will permanently decline by 59%. The mismatch between Ford’s profitability and growing cash flows and the market’s pessimistic valuation earn F a Very Attractive rating.
Haverty Furniture Companies HVT is one of my least favorite stocks held by Consumer Discretionary ETFs and mutual funds and earns my Very Dangerous rating. Haverty Furniture is not a very profitable company. Their ROIC has not exceeded their cost of capital in a single year of my model, and has been stuck below 5% since 2005. Those low returns mean that HVT is destroying shareholder value every single year. From 2010 to 2011, HVT’s NOPAT decreased from $20.0 million to $16.6 million. Some investors may have been fooled by their accounting bottom line, however. HVT’s Net Income increased from $8.44 million to $15.46. The reason for their accounting improvement is a non-recurring tax benefit of $14.1 million due to the reversal of the valuation allowance for their Deferred Tax Assets. Investors should not count on seeing a benefit like that again any time soon. The disconnect between HVT’s reported Net Income and their true operating profits is one of the reasons the company gets my Very Dangerous rating.
468 stocks of the 3000+ I cover are classified as Consumer Discretionary stocks, but Consumer Discretionary ETFs and mutual funds hold only 450 stocks.
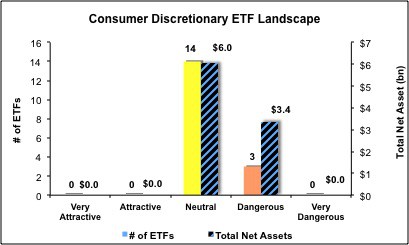
Figures 4 and 5 show the rating landscape of all Consumer Discretionary ETFs and mutual funds.
Our Sector Rankings for ETFs and Mutual Funds report ranks all sectors and highlights those that offer the best investments.
Figure 4: Separating the Best ETFs From the Worst ETFs
Sources: New Constructs, LLC and company filings
Figure 5: Separating the Best Mutual Funds From the Worst Mutual Funds
Review my full list of ratings and rankings along with reports on all 17 ETFs and 27 mutual funds in the Consumer Discretionary sector.
Disclosure: I own F. I receive no compensation to write about any specific stock, sector or theme.
Edge Rankings
Price Trend
© 2025 Benzinga.com. Benzinga does not provide investment advice. All rights reserved.
Trade confidently with insights and alerts from analyst ratings, free reports and breaking news that affects the stocks you care about.


