
Zinger Key Points
- Apple was attempting to break up from an inside bar and triangle pattern on Wednesday.
- The stock has been consolidating above the 200-day SMA since Feb. 3.
- Get access to your new suite of high-powered trading tools, including real-time stock ratings, insider trades, and government trading signals.
Apple, Inc AAPL was edging slightly higher Wednesday after consolidating with an inside bar on Tuesday amid the market digesting the latest consumer price index data.
Inflation ticked slightly lower last month, coming in at 6.4% compared to 6.5% in December. The number came in above the 6.2% expected by economists, which weighed on the S&P 500.
An inside bar pattern indicates a period of consolidation and is usually followed by a continuation move in the direction of the current trend.
See Also: Want To Use Apple's 'Buy Now Pay Later' Service? Hope You've Been A Good Consumer
An inside bar pattern has more validity on larger time frames (four-hour chart or larger). The pattern has a minimum of two candlesticks and consists of a mother bar (the first candlestick in the pattern) followed by one or more subsequent candles. The subsequent candle(s) must be completely inside the range of the mother bar and each is called an "inside bar."
A double, or triple inside bar can be more powerful than a single inside bar. After the break of an inside bar pattern, traders want to watch for high volume for confirmation the pattern was recognized.
- Bullish traders will want to search for inside bar patterns on stocks that are in an uptrend. Some traders may take a position during the inside bar prior to the break while other aggressive traders will take a position after the break of the pattern.
- For bearish traders, finding an inside bar pattern on a stock that's in a downtrend will be key. Like bullish traders, bears have two options of where to take a position to play the break of the pattern. For bearish traders, the pattern is invalidated if the stock rises above the highest range of the mother candle.
Want direct analysis? Find me in the BZ Pro lounge! Click here for a free trial.
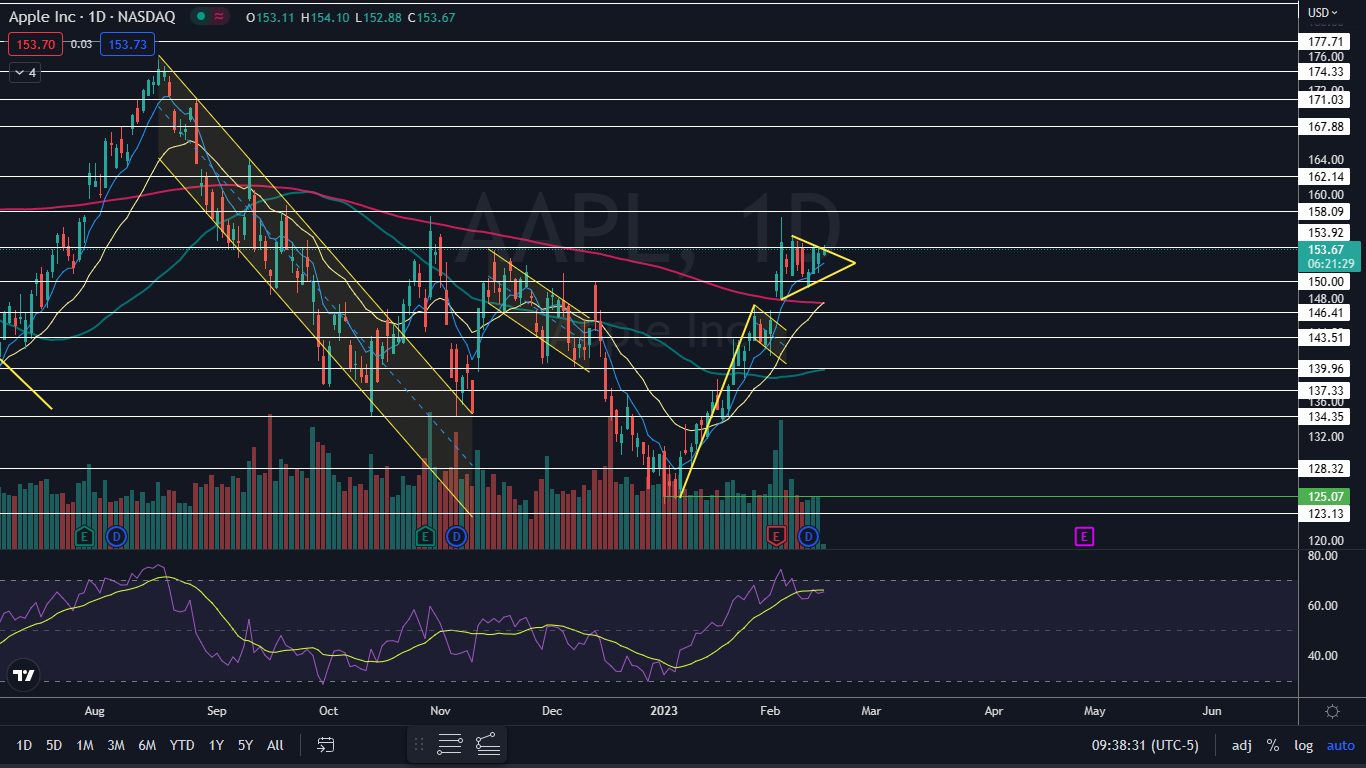
The Apple Chart: Apple broke up from a bull flag on Feb. 2, which caused the stock to gap up above the 200-day simple moving average (SMA) and regain the level as support. The following day, Apple back tested the 200-day as support and bounced up from the level to print a bullish engulfing candlestick.
- Since Feb. 6, each of Apple’s daily candlesticks has printed within Feb. 3’s trading range, which has caused the stock to form a series of inside bar patterns. The mother bar, paired with the inside bars, has also settled Apple into a triangle pattern, where the stock has made a series of lower highs and higher lows.
- Apple is set to hit the apex of the triangle pattern on Feb. 23. Traders and investors can watch for the stock to break up or down from the pattern on higher-than-average volume to gauge future direction, but the triangle leans bullish in this case.
- If Apple breaks up or down from Tuesday’s range on Wednesday, the stock will also break from the triangle pattern. If Apple breaks down from the triangle, bullish traders will want to see the stock bounce up from the 200-day SMA.
- Apple has resistance above at $153.92 and $158.09 and support below at $150 and $146.41.
 Read Next: Berkshire Hathaway Loads Up On Apple, Slashes TSM Stake In Q4
© 2025 Benzinga.com. Benzinga does not provide investment advice. All rights reserved.
Trade confidently with insights and alerts from analyst ratings, free reports and breaking news that affects the stocks you care about.

