Amazon.com, Inc AMZN was declining about 1.8% in the premarket Thursday, in tandem with stock futures, which began to nosedive at 8:30 a.m. EST when data was released indicating inflation remains sticky.
After the market opened, the stock began to erase some of its premarket losses.
January’s producer price index data, which measures wholesale prices, rose 0.7% compared to a 0.4% consensus estimate. U.S. jobless claims fell for the week ending Feb. 11, with 1,000 fewer claims filed than the week previous.
The data indicates the U.S. economy remains resilient in the face of the Federal Reserve, which has applied a series of interest rate hikes aimed at drastically cooling inflation. On Tuesday, consumer price index data also came in ahead of estimates.
The stock market has largely ignored the fundamental situation this year — that the central bank may need to continue applying pressure through further rate hikes into the spring — and Thursday’s lower open may prove to be a dip buying opportunity for the bulls.
Want direct analysis? Find me in the BZ Pro lounge! Click here for a free trial.
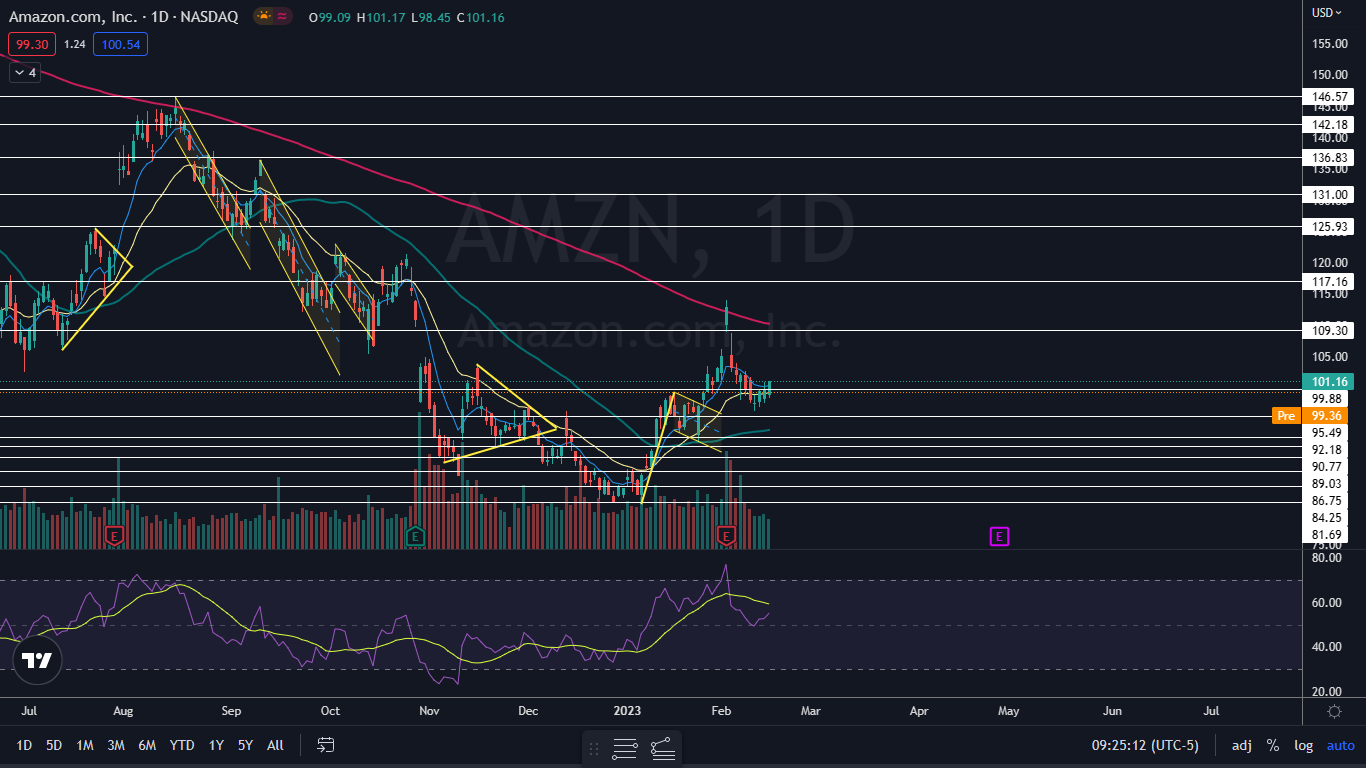
The Amazon Chart: Although Amazon fell for six days following its earnings print, where the company reported a big EPS miss, the stock hasn’t negated the uptrend in which it started trading Jan. 6. Amazon’s most recent higher high was formed on Feb. 2 at $114 and the most recent higher low was printed at the $96.23 mark on Feb. 10.
- On Thursday, Amazon was looking to print an inside bar pattern, opening near the lower range of Wednesday’s price action. The inside bar leans bullish in this case because Amazon was trading higher before forming the pattern, but traders can watch for a break up or down from Wednesday’s mother bar on higher-than-average volume to gauge future direction.
- Amazon is trading about 8% below the 200-day simple moving average (SMA), which the stock temporarily regained as support on Feb. 2. If Amazon’s uptrend continues, the stock will eventually regain the 200-day SMA, which would give bullish traders more confidence going forward.
- Amazon has resistance above at $99.88 and $109.30 and support below at $95.49 and $92.18.
 Read Next: Microsoft's ChatGPT Powered Bing Scores Win With User Engagement; Falters With Current Data
Photo via Shutterstock.
© 2024 Benzinga.com. Benzinga does not provide investment advice. All rights reserved.
Comments
Trade confidently with insights and alerts from analyst ratings, free reports and breaking news that affects the stocks you care about.