


Zinger Key Points
- Microsoft has been declining on lower-than-average volume, indicating a period of consolidation.
- The stock may be forming into a bull flag pattern, with a measured move of about 7%.
- Feel unsure about the market’s next move? Copy trade alerts from Matt Maley—a Wall Street veteran who consistently finds profits in volatile markets. Claim your 7-day free trial now.
Microsoft Corporation MSFT opened lower on Thursday ahead of key U.S. jobs data expected Friday.
The move came in tandem with the S&P 500, which was trading down about one quarter of a percent.
The tech giant has slid about 1% over the last two trading days on declining volume, which suggests a period of consolidation. The consolidation, after a 7% surge between March 28 and Tuesday, has Microsoft forming a possible bull flag pattern.
The bull flag pattern is created with a sharp rise higher forming the pole, which is then followed by a consolidation pattern that brings the stock lower between a channel with parallel lines or into a tightening triangle pattern.
- For bearish traders, the "trend is your friend" (until it's not) and the stock may continue downwards within the following channel for a short period of time. Aggressive traders may decide to short the stock at the upper trendline and exit the trade at the lower trendline.
- Bullish traders will want to watch for a break up from the upper descending trendline of the flag formation, on high volume, for an entry. When a stock breaks up from a bull flag pattern, the measured move higher is equal to the length of the pole and should be added to the lowest price within the flag.
A bull flag is negated when a stock closes a trading day below the lower trendline of the flag pattern or if the flag falls more than 50% down the length of the pole.
Want direct analysis? Find me in the BZ Pro lounge! Click here for a free trial.
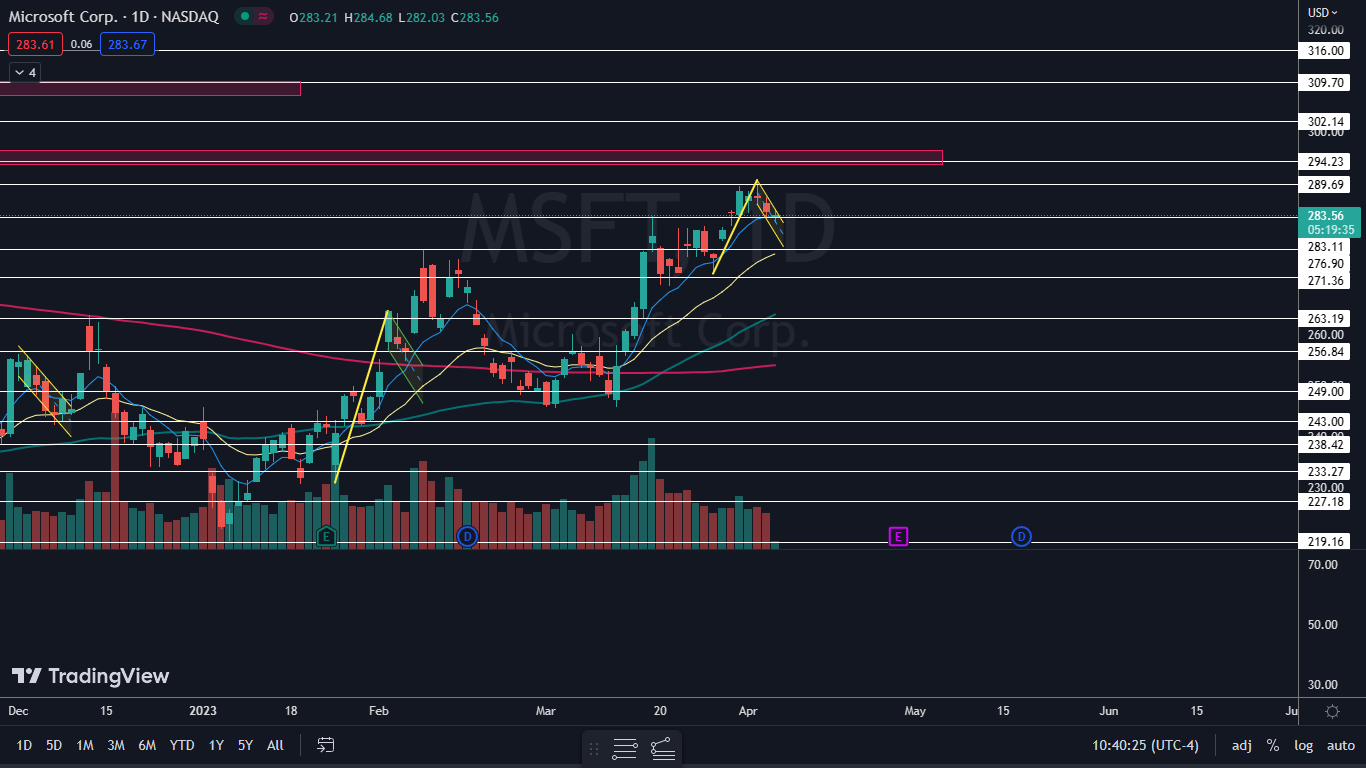
The Microsoft Chart: The measured move of Microsoft’s bull flag formation is about 7%, which suggests the stock could rise toward about $301 on a break of the pattern. Traders can watch for the stock to eventually break up above the upper descending trendline of the flag on higher-than-average volume to gauge whether the bull flag was recognized.
- If Microsoft breaks up from the bull flag pattern, the stock will fill an upper gap that exists between about $293 and $296. If that happens, Microsoft may find at least temporary resistance at the upper range of the gap.
- If Microsoft breaks down under the eight-day exponential moving average (EMA), the bull flag will be negated and traders can watch for a different pattern to eventually develop. If Microsoft loses support at the eight-day EMA, the stock may find support at the 21-day EMA.
- On Thursday, Microsoft was working to print a doji candlestick on the daily chart, which could indicate the local low has occurred and a rebound is in the cards for Monday. The stock is trading in an uptrend, which is likely to continue unless Microsoft falls under the $272 mark or forms a lower high over the next few days.
- Microsoft has resistance above at $289.69 and $294.23 and support below at $283.11 and $276.90.
 Read Next:
 Edge Rankings
Price Trend
© 2025 Benzinga.com. Benzinga does not provide investment advice. All rights reserved.
Trade confidently with insights and alerts from analyst ratings, free reports and breaking news that affects the stocks you care about.

