


Zinger Key Points
- Bitcoin, Ethereum and Dogecoin settle into different bullish patterns.
- Traders can watch to see how the cryptos react to jobs numbers, expected Friday morning.
- Our government trade tracker caught Pelosi’s 169% AI winner. Discover how to track all 535 Congress member stock trades today.
Bitcoin BTC/USD was trading flat during Thursday’s 24-hour trading session, continuing in a sideways pattern heading into the long weekend, when the stock market will be closed for three days including Friday.
While traders and investors won’t be able to see an immediate reaction to key job numbers, expected to be released Friday morning, in the stock market investors can watch to see how the crypto sector reacts. The reaction of Bitcoin to the jobs numbers may provide clues as to how the stock market will trade on Monday.
Unfortunately for stock market investors, the crypto sector has become detached from the general market recently, which may make next week’s price action in the S&P 500 more difficult to predict.
For crypto traders, Bitcoin’s long-term sideways pattern appears bullish, while Ethereum ETH/USD and Dogecoin DOGE/USD look to have different bullish formations setting up.
Here’s what to watch on the three cryptos over the holiday weekend.
Want direct analysis? Find me in the BZ Pro lounge! Click here for a free trial.
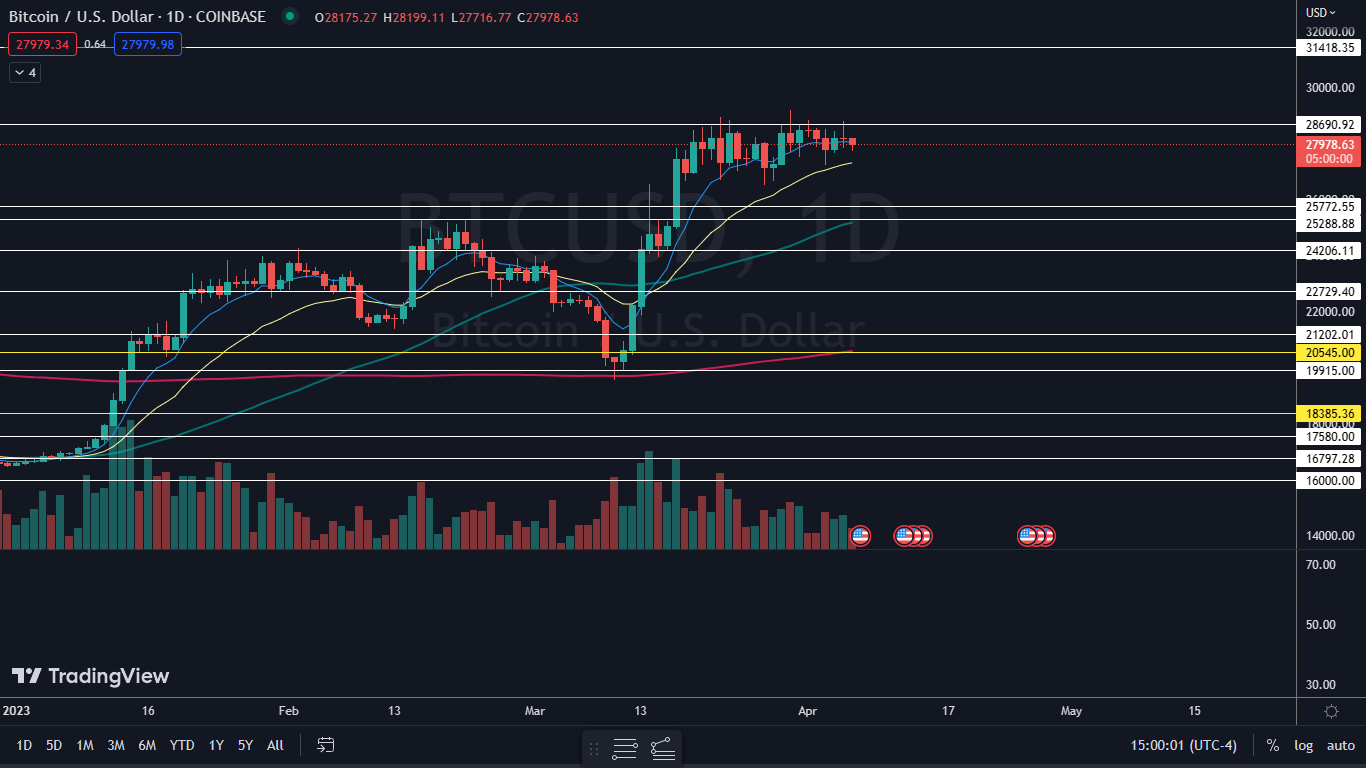
The Bitcoin Chart: Bitcoin has been trading under a key resistance level near the $28,700 mark since March 19. The sideways pattern has been formed on decreasing volume, which indicates the crypto is running out of both sellers and buyers.
The pattern leans bullish but traders and investors can watch for big bullish volume to come in and break Bitcoin up from that level, which could signal a larger move to the upside is on the horizon. Alternatively, bears want to see big bearish volume come in and drive Bitcoin down under the 21-day exponential moving average (EMA), which could signal a downtrend is in the cards.
Bitcoin has resistance above at $28,690 and $31,418 and support below at $25,772 and $25,228.
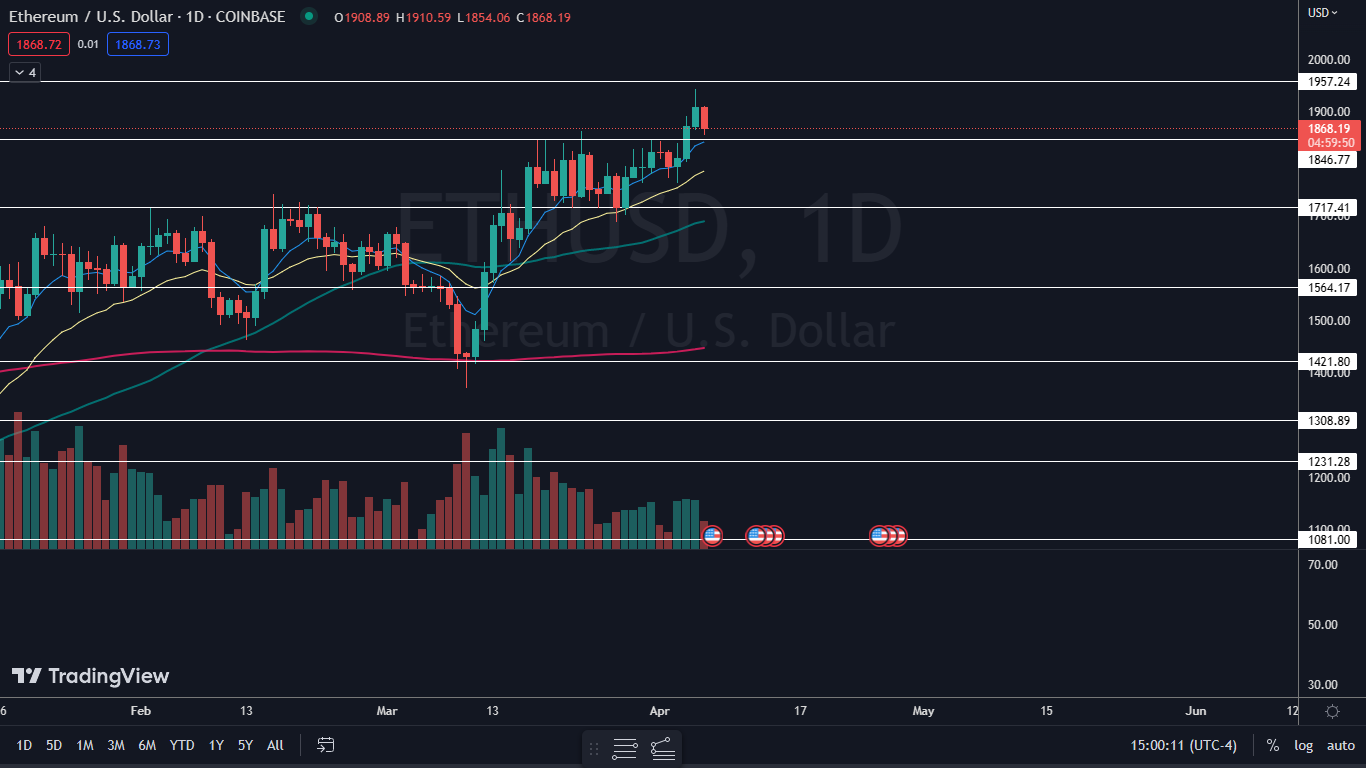
 The Ethereum Chart: Ethereum started trading in an uptrend on March 27 and has made a consistent series of higher highs and higher lows. Ethereum’s most recent higher low was formed on Monday at $1,763 and the most recent higher high was printed at the $1,943 mark on Wednesday.
On Thursday, Ethereum was trading slightly lower, looking to print a hammer candlestick, which could indicate the next higher low has occurred and the crypto will resume its uptrend and bounce on Friday. Bearish traders want to see Ethereum break down under Monday’s low-of-day, which will negate the uptrend.
Ethereum has resistance above at $1,957 and the psychologically important $2,000 level and support below at $1,846 and $1,717.
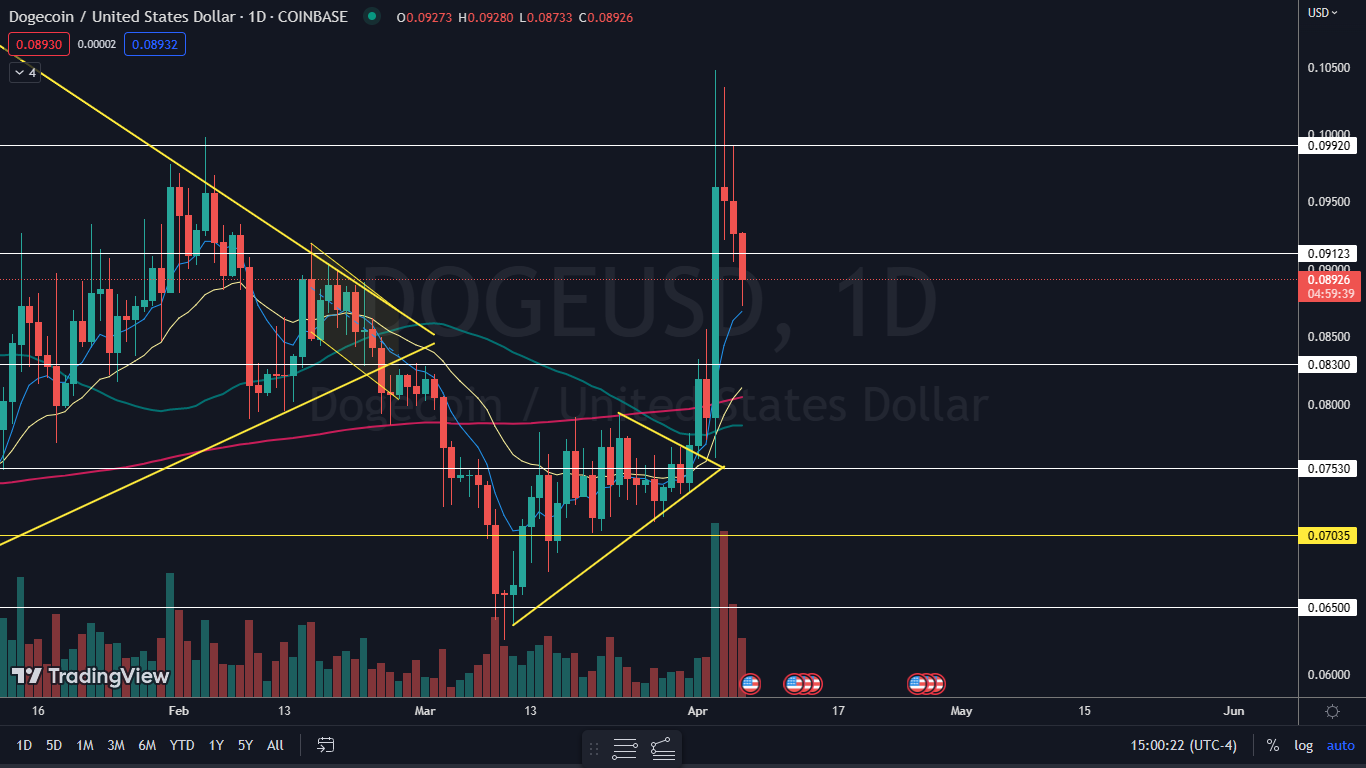
 The Dogecoin Chart: Dogecoin was trading over 3% lower during Thursday’s trading session but on lower-than-average volume, which indicates consolidation. The crypto may be forming a bull flag pattern, with the 38% surge on Monday making up the pole of the formation and the three-day decline making up the flag.
If the pattern is recognized, Dogecoin could be headed for the 12-cent mark. If Dogecoin closes under the eight-day EMA, the bull flag will be negated.
Dogecoin has resistance above at $0.091 and $0.099 and support below at $0.083 and $0.075
Read Next: Is Microsoft Heading Over The $300 Mark? The Bull, Bear Case For The Tech Giant
© 2025 Benzinga.com. Benzinga does not provide investment advice. All rights reserved.
Trade confidently with insights and alerts from analyst ratings, free reports and breaking news that affects the stocks you care about.

