Zinger Key Points
- Shiba Inu confirms a new uptrend on Thursday by forming a higher high after forming a higher low on Wednesday.
- Bullish traders want to see the eventual consolidation take place above the 50-day SMA.
- Get 5 stock picks identified before their biggest breakouts, identified by the same system that spotted Insmed, Sprouts, and Uber before their 20%+ gains.
Shiba Inu SHIB/USD was climbing up over 6% at one point during Thursday’s 24-hour trading session, attempting to confirm a new uptrend pattern on the daily chart.
The move higher came in tandem with Dogecoin DOGE/USD, which was spiking over 6% higher amid bullish price action in the crypto sector following a landmark ruling by a U.S. judge, who determined that Ripple's sales of the XRP token XRP/USD do not constitute an offer of investment contracts.
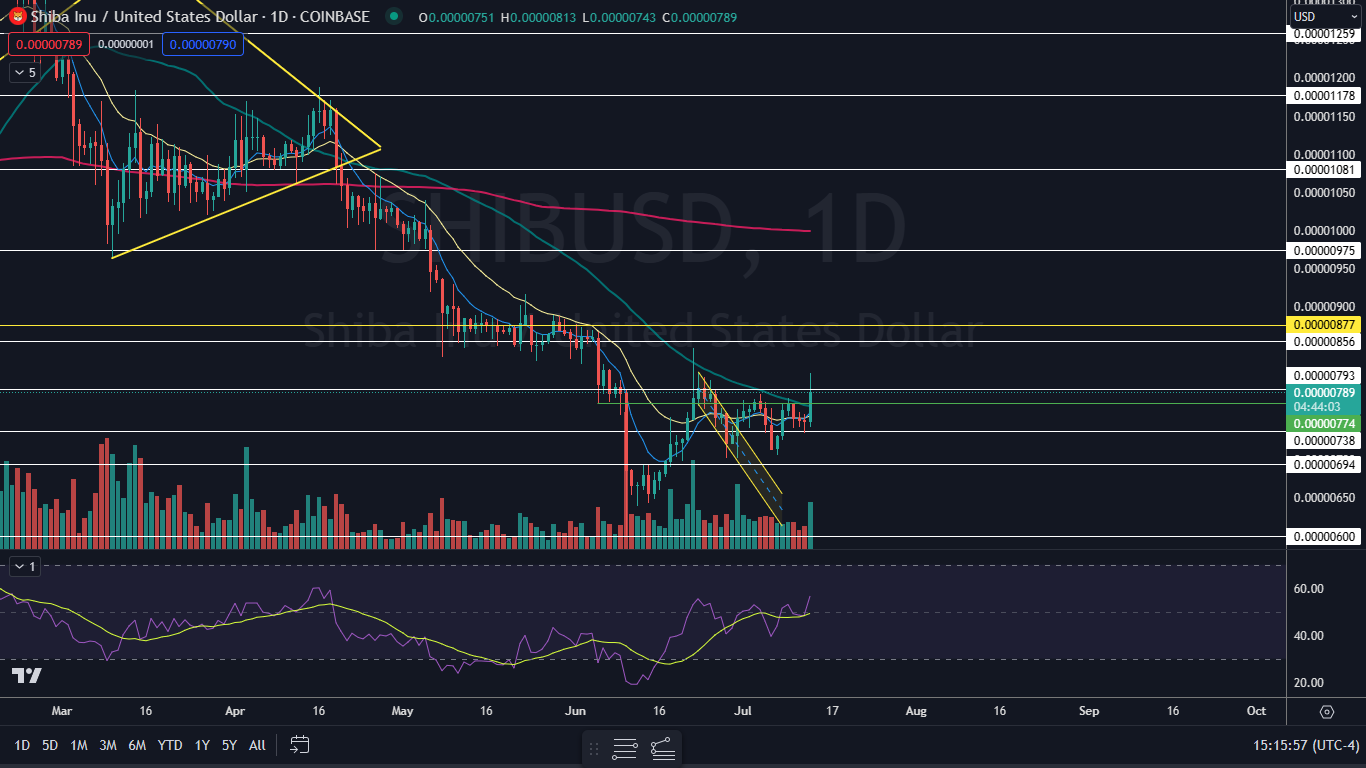
Shiba Inu’s bullish reaction to the news saw the crypto regain the 50-day simple moving average (SMA) as it formed a higher high to confirm a new uptrend. The crypto’s downtrend was negated during Wednesday’s 24-hour session when Shiba Inu formed a higher low of $0.00000735.
An uptrend occurs when a stock or crypto consistently makes a series of higher highs and higher lows on the chart. The higher highs indicate the bulls are in control while the intermittent higher lows indicate consolidation periods.
For Shiba Inu confirmed the uptrend when it surpassed the July 9 lower high of $$0.00000781.
Want direct analysis? Find me in the BZ Pro lounge! Click here for a free trial.
The Shiba Inu Chart: When Shiba Inu burst upward to print its higher high, it also negated a possible bearish double top pattern, which is a good sign for the bulls. Bullish traders who aren’t already in a position may choose to wait for the crypto to print its next higher low before entering a position.
- Shiba Inu’s move higher was taking place on higher-than-average volume, which suggests the bulls are attempting to regain control and have an increased interest in the crypto. If Shiba Inu closes the 24-hour session near its high-of-day, the crypto will form a bullish Marubozu candlestick, which could indicate it will trade higher again during Friday’s session.
- The next most likely scenario is that Shiba Inu will trade sideways on Friday to form an inside bar pattern. Bullish traders would like to see that take place above the 50-day SMA. If the crypto falls back below the 50-day, the area could act as resistance during further 24-hour trading sessions.
- Bearish traders want to see bullish volume begin to decrease and then for big bearish volume to come in and knock Shiba Inu back under the 50-day, which could cause the crypto to test the $0.00000738 mark as support. If Shiba Inu were to fall under that area, a move downward could accelerate.
- Shiba Inu has resistance above at $0.00000856 and $0.00000975 and support below at $0.00000793 and $0.00000738.

Photo: Shutterstock
© 2025 Benzinga.com. Benzinga does not provide investment advice. All rights reserved.
Trade confidently with insights and alerts from analyst ratings, free reports and breaking news that affects the stocks you care about.