Eyes will be on Bitcoin BTC/USD and Ethereum ETH/USD this weekend considering the recent uptick in stock market volatility following the Federal Reserve's recent decision to apply a 0.25% rate hike.
The interest rate adjustment has heightened interest in weekend cryptocurrency movements, as the crypto sector often offers clues about how the stock market may react when Wall Street resumes trading on Monday.
During the latest 24-hour trading session, Bitcoin and Ethereum remained relatively stable, while Dogecoin appears to be consolidating above the 200-day simple moving average (SMA) after surging almost 14% to regain the area between Monday and Tuesday.
Investors and traders are closely monitoring crypto trends in anticipation of significant reactions in both traditional and digital markets next week.
Want direct analysis? Find me in the BZ Pro lounge! Click here for a free trial.
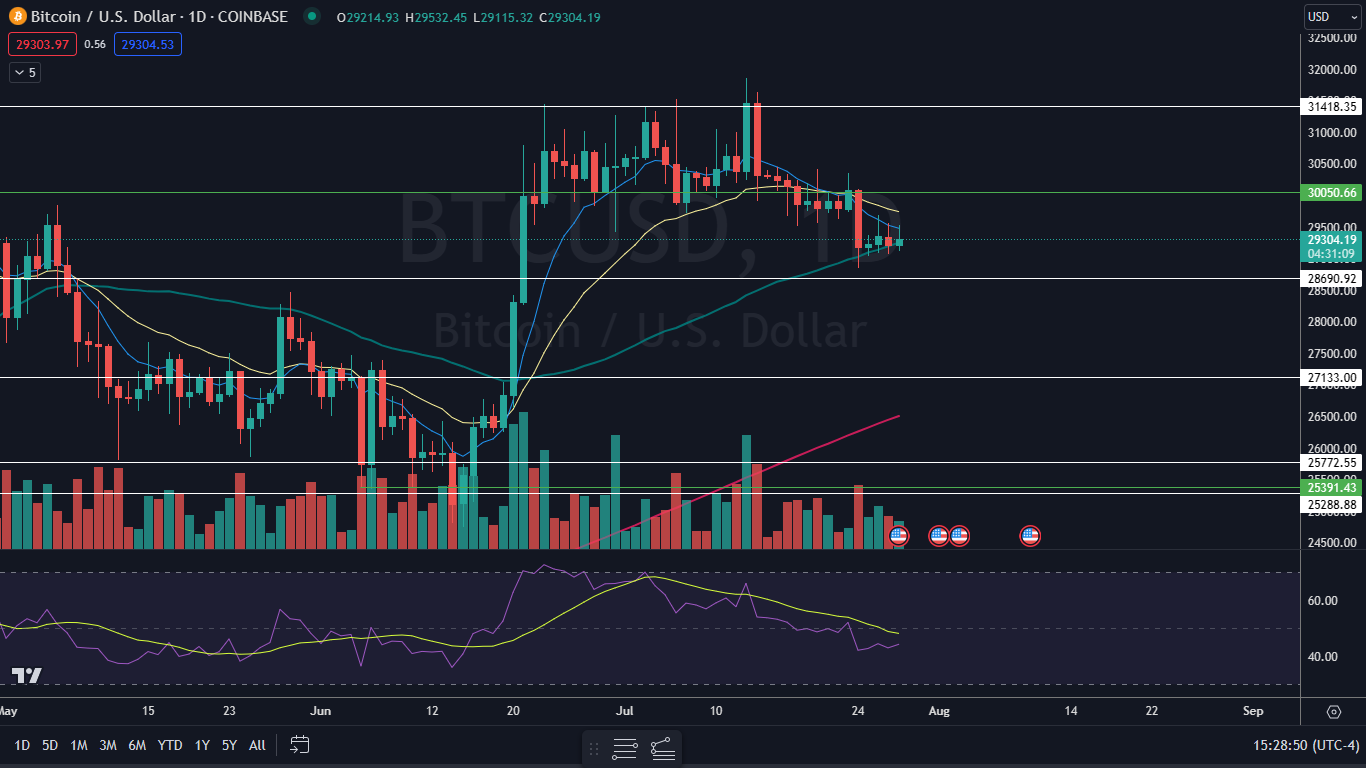
The Bitcoin and Ethereum Charts: Bitcoin and Ethereum have been trading sideways since Monday, when the cryptos fell 3% and 2%, respectively. The sideways consolidation has caused Bitcoin and Ethereum to form quadruple inside bars on decreasing volume, which indicates consolidation.
The consolidating has been taking place just under significant support and resistance levels, which suggests either accumulation or distribution is taking place. Bitcoin has been trading sideways under the $30,000 mark, while Ethereum has been in the same trading pattern under $2,000.
Traders and investors can watch for big volume to eventually come in and break the crypto up or down from their sideways pattern, and the mother bars, on higher-than-average volume to gauge future direction.
Bitcoin has resistance above at $30.081 and at $31,418 and support below at $28,690 and at $27,133.
 Ethereum has resistance above at $1,937 and at $2,020 and support below at $1,825 and at $1,717.
 The Dogecoin Chart: Dogecoin regained the 200-day SMA and has since been consolidating slightly lower above that area. The surge above the 200-day, paired with the recent consolidation may have formed Dogecoin into a bull flag pattern on the daily chart.
If the pattern is recognized, the measured move indicates Dogecoin could rise up toward $0.09. For the pattern to be confirmed, Dogecoin will need to break up through the flag on higher-than-average volume.
Bearish traders want to see big bearish volume come in and knock Dogecoin back under the 200-day SMA, which could accelerate downside pressure and confirm a downtrend.
Dogecoin has resistance above at $0.083 and at $0.091 and support below at $0.075 and at $0.069.
Photo: Pixabay
© 2024 Benzinga.com. Benzinga does not provide investment advice. All rights reserved.
Comments
Trade confidently with insights and alerts from analyst ratings, free reports and breaking news that affects the stocks you care about.
 Read More: