GDP growth rate is improving. In the first half of 2023, China’s GDP grew by 5.5% year-on-year. By quarter, it grew by 4.5% in the first quarter and 6.3% in the second quarter. In the first and second quarters of 2022, GDP grew by 4.8% and 0.4% respectively. Under the low base of last year and the policy of fully opening up the economy for epidemic prevention and control, the GDP achieved a good start in the first half of the year.

The market is optimistic about GDP growth, but both manufacturing PMI and non-manufacturing PMI have shown some decline. From April to June 2023, the manufacturing PMI has been below the boom-bust line for three consecutive months. Last November, real estate support policies were introduced, and in December, epidemic prevention and control measures were fully lifted, which has boosted market confidence in economic recovery and led to a significant increase in PMI in January and February this year. However, with continuous interest rate hikes in Europe and the United States and weak external demand, the PMI has fallen below the boom-bust line again in the past three months.

Chart SEQ Chart * ARABIC6 Mainland Manufacturing PMI and Non-Manufacturing PMI, Data Source: Wind
In June 2023, China’s CPI remained unchanged year-on-year, with an expected increase of 0.2%. PPI decreased by 5.4% year-on-year, with an expected decrease of -5.00%, and a month-on-month decrease of 0.8%. From the data, since October 2022, the PPI has been negative growth for 9 consecutive months, while the CPI has been below 1% for 4 consecutive months (0% in June). Currently, domestic prices are generally stable. As the economy further recovers, the price level will gradually rise. The probability of a year-on-year decline in PPI has likely bottomed out and is expected to narrow in the future.

Figure SEQ Figure \* ARABIC 7 China’s CPI and PPI, Data Source: Wind
In June 2023, the total retail sales of consumer goods reached 3.9951 trillion yuan, a year-on-year increase of 3.1%. In the first half of the year, the total retail sales of consumer goods reached 22,758.8 billion yuan, a year-on-year increase of 8.2%. Among them, the retail sales of consumer goods excluding automobiles reached 20,517.8 billion yuan, an increase of 8.3%.

Chart SEQ Chart * ARABIC8 Mainland Retail Sales (YoY), Data Source: Wind
In terms of urban fixed asset investment, from January to June 2023, urban fixed asset investment reached 24,311.3 billion yuan, an increase of 3.8% year-on-year. Among them, private fixed asset investment reached 12,857 billion yuan, a decrease of 0.2% year-on-year. In terms of different sectors, infrastructure investment increased by 7.2% year-on-year, manufacturing investment increased by 6.0%, and real estate development investment decreased by 7.9%.

Figure SEQ Figure\*ARABIC9 China’s urban fixed asset investment annual rate, Data Source: Wind
LPR cut. In June, after nine months of inaction, China’s loan market quoted interest rate (LPR) was once again lowered by 10 basis points, from the previous 4.3% to 4.2%. Meanwhile, major commercial banks have successively lowered their mortgage interest rates, generally by 10 basis points. On the other hand, the net interest margin of banks has also decreased again, with the net interest margin of large commercial banks dropping from 1.9% to 1.69%.
The decline in LPR will have positive effects: 1) it will once again convey policy signals of stabilizing growth and promoting development, further stabilizing market expectations and boosting market confidence; 2) it will lower the financing costs for the real economy, as the interest rates of existing loans priced with LPR will decrease, and the interest rates of new loans are also expected to decrease, which will help stimulate effective financing demand; 3) it will promote the stable and healthy development of the real estate market, as both the interest rates of existing housing loans and new housing loans will decrease, which will help boost household consumption and investment.

China’s five-year loan prime rate (LPR) and large commercial banks’ net interest margin, Data Source: Wind
Since March 2022, after 10 rate hikes totaling 500 basis points, the target federal funds rate in the United States has risen to 5.00%-5.25%, reaching a 20-year high. The market believes that the peak of this interest rate hike cycle will be 5.00% in 2022. After the CPI in January this year fell less than expected, the market raised the peak expectation to 5.25%. Although the CPI continues to stabilize and fall, the core PCE remains high. The Federal Reserve continues to emphasize the importance of fighting inflation and release hawkish signals, causing the market to raise the peak expectation to 5.5%. Will the future peak be raised again, the core factor is still inflation, especially core inflation.

Figure SEQ Figure \* ARABIC 11 US Federal Benchmark Interest Rate, Data Source: Wind
The US CPI is steadily declining. In June 2023, the US CPI rose by 3.0% year-on-year, with an expectation of 3.1% and a previous value of 4%, marking a continuous 12-month decline. The core CPI, excluding food and energy, rose 4.8% year-on-year, lower than the expected 5% and the previous value of 5.3%, marking the lowest level since October 2021, but still far above the Federal Reserve’s target.
In January 2020, the last month before the outbreak, the US CPI was 2.50%, and the core CPI was 2.30%.

Figure SEQ figure\* ARABIC 12 US CPI and Core CPI, Data Source: Wind
The US CPI enters the “3” era, but it basically does not affect the 25 basis point interest rate hike by the Federal Reserve in July. According to the latest data from the Investing Fed Rate Monitor, the probability of a 25 basis point rate hike in July is 93%, and the market basically assumes/accepts another 25 basis point rate hike. At the same time, given the positive downward trend in inflation data, it has increased the possibility of the Fed stopping rate hikes after a possible rate hike in July.

Figure SEQ Figure \* ARABIC13 Fed Rate Observer, Data source: investing.com
The year-on-year growth rate of US PPI in June slowed down from 1.1% in the previous month to 0.1%, lower than the expected 0.4%, hitting a new low since August 2020. On a month-on-month basis, it increased by 0.1%, lower than the expected 0.2%. The year-on-year increase in core PPI in June was 2.4%, lower than the expected 2.6%, reaching the lowest level since February 2021. The month-on-month increase in core PPI was only 0.1%, lower than the expected 0.2%.
Following the unexpected decline in CPI, US PPI in June also cooled more than expected, reinforcing market expectations that the Fed’s rate hikes are coming to an end. After the release of PPI data, the market expects a high probability of no rate hike by the Federal Reserve in September, reaching 82%.

Figure SEQ Figure \* ARABIC 14: Federal Reserve Rate Observer, Data source: investing.com
China’s GDP Growth Rate In 2023 May Reach 5.6%
According to the World Bank’s “China Economic Brief: Sustaining Growth, Surpassing Rebalancing,” the World Bank has raised its economic growth forecast for China in 2023.
The World Bank predicts that China’s GDP growth rate in 2023 may reach 5.6%, significantly higher than the 4.3% forecasted in the January Global Economic Outlook report and the 5.1% in the April East Asia and Pacific Economic Update.
With the lifting of travel restrictions and a surge in service spending, economic activity rebounded in the first quarter of 2023, but growth momentum has slowed since April. The GDP growth rate in the first quarter of this year increased by 4.5% year-on-year, higher than the 3% growth rate for the whole year of 2022. The recovery in the first quarter was due to factors such as the release of suppressed consumer demand, preliminary improvement in real estate activities, and policy support.
According to the World Bank report, the growth of the economy in 2023 will be led by strong rebound in consumer demand, especially for service consumption. Capital expenditure for infrastructure and manufacturing is expected to remain resilient. However, due to weak external demand and a slight rebound in import growth due to improved domestic demand, net exports are expected to drag down growth.

China’s economic indicators and their forecast values, Data source: World Bank
Expectations For Profit Growth In China’s Major Stock Indices
As we enter 2023, listed companies continue to strengthen their operations. The total operating income of 5,155 A-share listed companies that have disclosed their first quarter reports exceeded 17 trillion yuan, a year-on-year increase of 3.8%; the total net profit attributable to the parent company reached nearly 1.5 trillion yuan, a year-on-year increase of 1.42%.
From the perspective of the industrial chain, the recovery of the performance of the consumer sector has driven the rebound of A-share net profit growth, while the profit pressure on the midstream materials (steel, basic chemicals, building materials) has dragged down A-share net profit.
Among the 31 primary sub-industries of the Shenwan Index, 19 industries saw year-on-year growth in net profit attributable to the parent company in the first quarter. Among them, social services, comprehensive, agriculture, forestry, animal husbandry and fishery, non-banking financial, and computer industries ranked in the top five in terms of net profit growth, with year-on-year growth rates of 139.8%, 82.5%, 70.8%, 64.7%, and 57.6% respectively; utilities, power equipment, retail trade, beauty care, and food and beverage industries all had net profit growth rates exceeding 15%.
Among specific companies, a total of 2,751 companies saw a year-on-year increase in net profit attributable to shareholders in the first quarter, accounting for approximately 53.4%. Among them, the net profit of 796 A-share companies doubled in the first quarter.
According to Bloomberg’s consensus expectations, the MSCI China Index is expected to have a net profit growth rate of 13.2% in 2023, the Hang Seng China Enterprises Index is expected to have a net profit growth rate of 3.9% in 2023, the Hang Seng Index is expected to have a net profit growth rate of 14.3% in 2023, the CSI 300 Index is expected to have a net profit growth rate of 14.3% in 2023, the Shanghai Composite Index is expected to have a net profit growth rate of 24.5% in 2023, and the China Concept Stocks Index is expected to have a net profit growth rate of 51.9% in 2023.

Figure SEQ Figure\*ARABIC15 Major Chinese Stock Indexes 2023/2024 Earnings Growth Expectations, Data source: Bloomberg
Improvement In Hong Kong’s Liquidity
The Federal Reserve has maintained a tightening monetary policy in the first half of this year under inflation pressure. As of June this year, the target range for the US federal funds rate has been maintained at 5%-5.25%. A cumulative increase of 75 basis points since the beginning of this year. The latest interest rate decision remains unchanged, implementing the first pause in this round of interest rate hikes. However, subsequent policy statements and official remarks convey a firm hawkish stance. The dot plot shows that the median target interest rate for 2023 has been raised by 50 basis points, implying that there is still room for interest rates to rise this year.

Image SEQ image * ARABIC16 June dot matrix, Data Source: Federal Reserve
However, despite the resilience shown in economic data, interest rate adjustments still need to consider the lag of monetary policy. The guidance given by Federal Reserve officials is that tightening will be maintained in 2023, and the first rate cut is likely to occur in 2024, depending on the specific performance of the US economy. The uncertainty of short-term interest rates is high, and the volatility of short-term bonds may amplify the situation of an inverted yield curve. Specifically reflected in the interest rate environment in Hong Kong. The Hong Kong Monetary Authority has followed the Federal Reserve in raising the basic discount window rate, reflecting the trend of Hong Kong’s benchmark interest rate in the US region. With inflation cooling down, the current interest rate hike cycle of the Federal Reserve is gradually approaching its end, and the space for further increase in local interest rates in Hong Kong may already be limited. As interest rates approach their peak, liquidity in the Hong Kong market is expected to improve at the currency environment level.

Hong Kong interest rate trends synchronized with the United States, Data source: Hong Kong Monetary Authority, Federal Reserve
Short-term liquidity in the Hong Kong stock market has been suppressed by the continued tightening of monetary policy in the United States, but there is hope for marginal improvement. In the first half of this year, there was a continuous inflow of funds overall, but the trading activity in the Hong Kong stock market was relatively volatile in terms of fund flows.
By the end of June, the net inflow of southbound funds has exceeded HKD 1.4 trillion. Among them, in the first quarter, the net inflow of southbound funds totaled HKD 24.39 billion, and in the second quarter, the net inflow totaled HKD 26.77 billion. Since the first half of this year, the net inflow of southbound funds has totaled HKD 50.79 billion. The outflow of southbound funds was more pronounced from the end of January to February this year, mainly due to the domestic economic situation and the ongoing “balloon” incident at the end of January, resulting in a significant net outflow in February.
However, although geopolitical risks have eased for now, China’s economic recovery will not happen overnight, laying a relatively good fundamental foundation for the performance of the Hong Kong stock market. The trend of continuous long-term inflow of southbound funds is obvious, despite the risks of investment restrictions by the United States on China.

Southbound funds showed a net inflow in the first half of this year, as shown in SEQ chart *ARABIC18.,
Looking at specific stocks, as of July 4th, Tencent Holdings (0700.HK) had a net purchase of 67.065 billion RMB, China Mobile (00941.HK) had a net purchase of 20.796 billion RMB, and WuXi Biologics (02269.HK) had a net purchase of 8.687 billion RMB. Construction Bank (00939.HK) had a net sale of 20.62 billion RMB, Industrial and Commercial Bank (1398.HK) had a net sale of 4.041 billion RMB, and Meituan-W (3690.HK) had a net sale of 3.826 billion RMB.

Figure SEQ Figure \* ARABIC19 Top ten stocks bought and sold by southbound funds (in RMB billions), Data source: Wind Note: As of July 4th, the most recent year
In the long term, the internationalization of the renminbi and the gradual opening of the securities market are long-term factors supporting the liquidity of Hong Kong stocks. With the short-term pressure on Hong Kong stock liquidity diminishing, the long-term growth trend is expected to continue, and the situation of insufficient liquidity is expected to further improve. Emerging markets have always been key allocation markets for overseas institutional investors, and their attractiveness has not diminished. Short-term outflows have a relatively low impact on long-term incremental funds.
Dual Counter Mode Launched, Bringing Vitality To The Hong Kong Stock Market
The Hong Kong Stock Exchange started operating the “Hong Kong Dollar-Renminbi Dual Counter Model” on June 19. Dual counter mode refers to the overall process, dealer activities, and settlement mode of the Hong Kong dollar-renminbi dual counter transaction. Under the dual counter model, investors can choose to trade securities of the same issuer in Hong Kong dollars or Renminbi, and can conduct cross-counter transactions between the Hong Kong dollar counter and the Renminbi counter. Qualified securities can be traded on both the Hong Kong dollar and Renminbi trading counters, and investors can choose to use either currency for buying, selling, and settlement. Securities that trade essentially with different counterparty and settlement currencies belong to the same category, and there is a dedicated dual-counterparty market maker mechanism to address the spread and liquidity issues in this mode.
Simply put, the dual counter model means that the relevant securities can be traded on both the Hong Kong dollar and Renminbi counters. Investors can choose to trade designated securities in either Hong Kong dollars or Renminbi without the need for currency exchange. From the perspective of trading mechanism, the dual counter model has the opportunity to reduce transaction friction costs while providing investment convenience, thereby attracting capital inflows into the Hong Kong market. This provides an investment path for investors holding RMB in offshore markets to invest in RMB assets.
As an offshore market, Hong Kong has already accumulated a certain amount of RMB deposits in the currency market. Over the past decade, the scale of RMB deposits in Hong Kong has grown steadily, with the volume once surpassing 1 trillion RMB. As of May 2023, the RMB deposit scale in the Hong Kong banking system reached 891.7 billion RMB. In terms of scale, the proportion of offshore renminbi holders’ deposits in the banking system fluctuates between 10% and 5%. These funds may theoretically be transferred to RMB counter trading during the strong phase of RMB assets.

Chart SEQ Chart * ARABIC20 Steady Increase in RMB Deposits in Hong Kong, Data source: Hong Kong Monetary Authority
Currently, there are 24 securities approved by the Hong Kong Stock Exchange to establish RMB counters, mainly concentrated in large listed companies. These stocks account for nearly 40% of the Hang Seng Index and have potential for further expansion in the future. Among the listed companies, there are 22 stocks with a market value of over 100 billion, most of which are leading enterprises in various industries. Such as Tencent Holdings, Alibaba-SW, Baidu, Meituan-W, in the internet technology industry, as well as China Ping An and Hang Seng Bank in the financial sector. It is expected that with the inclusion of southbound capital in the dual counter trading scope, the RMB counter will attract more capital inflows.

Figure SEQ Figure \* ARABIC 21: Dual Counter Securities Table, Data source: Wind
The Hong Kong economy has been impacted by events such as the pandemic and geopolitical tensions, as well as facing multiple pressures such as supply chain disruptions and global interest rate hikes. However, in the transitional year of 2023, with the gradual alleviation of multiple economic constraints, the Hong Kong economy is expected to improve and gradually recover. With the deepening of RMB internationalization, the valuation of RMB assets is gradually recovering. The establishment of the dual counter model helps promote more efficient flow of offshore RMB in the international market.
Hong Kong Stock Market Valuation Repair
As of July 4th, the current price-to-earnings ratio (TTM) of the Hang Seng Index is 9.67 times, lower than the median price-to-earnings ratio of the past 10 years, which is 10.2 times. In the past decade, the highest P/E ratio of the Hang Seng Index was 14.93 times, the lowest was 7.45 times, and the average was 10.58 times. The current value is significantly below the average level and below the 20th percentile chance value. The current P/E ratio is at the 32.68th percentile of the past ten years.
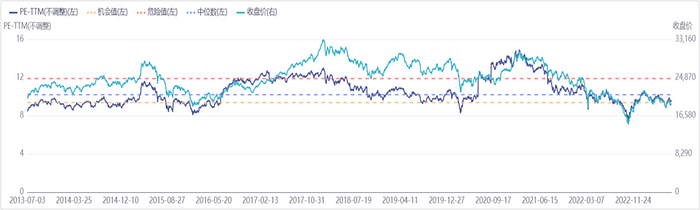
Trend of Hang Seng Index Price-to-Earnings Ratio (TTM), Data Source: Wind
As of July 4th, the PB ratio of the Hang Seng Index is 0.99 times, lower than the median P/B ratio of the past 10 years, which is 1.15 times. In the past decade, the maximum PB ratio of the Hang Seng Index was 1.44 times, the minimum was 0.75 times, and the average was 1.15 times. The current PB ratio is lower than the average level and below the 20th percentile opportunity value of 1.01, at the 17.88th percentile of the past decade.

Chart SEQ Chart * ARABIC23 Hang Seng Index Price-to-Book Ratio Trend, Data Source: Wind
In general, valuation indicators exhibit mean reversion. Mean reversion refers to the phenomenon where the price of a stock and its corresponding return rate will revert to its long-term average level within a certain time range. When the PE deviates from its long-term average level, the future return rate of the stock will drive the PE to return to its average level. In the stock market, PE is an indicator used to measure stock valuation. When the market’s PE is high, the future stock returns tend to be low, and when the market’s PE is low, the future stock returns tend to be high, PB is the same. The underlying assumption behind the simple use of PE and PB historical percentiles for market timing is the mean reversion theory, which suggests that valuation indicators will fluctuate around their mean. From historical data, the valuation indicators of major Hong Kong indices are at historical lows, which is attractive from a valuation perspective.
The content contained is provided for reference only and does not constitute a distribution, an offer to sell or a solicitation of an offer to buy any securities. This content has been prepared without regard to the individual investment objectives, financial position or special requirements. Past performance has no indication of future performance, and actual events may differ materially from that which is contained in the content. The value of, and returns from, any investments contained in the report are uncertain and are not guaranteed and may fluctuate because of their dependence on the performance of underlying assets or other variable market factors. The content and information contained are prepared and interpreted based on publicly available information collected from reliable sources. EDDID has exerted every effort in its capacity to ensure, but not to guarantee, their accuracy, completeness, timeliness, or correctness. You should not make any investment decision solely based on this content, EDDID shall not be liable for any loss, damage, or expense whatsoever, whether direct or consequential, incurred in relying on the information contained in this content. Any form of unauthorized distribution, reproduction, publication, release or quotation is prohibited without EDDID’s written permission or it is possible to violate relevant regulations. This content should not be copied or repost in Mainland China.
© 2024 Benzinga.com. Benzinga does not provide investment advice. All rights reserved.
Trade confidently with insights and alerts from analyst ratings, free reports and breaking news that affects the stocks you care about.

