Zinger Key Points
- Alphabet is trading in a downtrend between two parallel trend lines, which has set the stock into a falling channel pattern.
- The pattern leans bearish for the short term but can be bullish down the road.
- In a market dominated by tariff tensions, geopolitical surprises, and Fed uncertainty, Matt Maley's technical approach delivers clear entry & exit points for consistent income potential. Try it free for 7 days
Alphabet, Inc GOOG GOOGL dropped about 2.6% at one point during Friday’s trading session, despite announcing its Android 14 phones will come equipped with emergency SOS via satellite –a service considered one of the best features of the iPhone.
The big-tech stock was dragged lower by the general market, which saw the S&P 500 gap down 0.58% to start the last trading day of the week, due to increased concerns the Federal Reserve will continue its rate hike campaign into the end of the year.
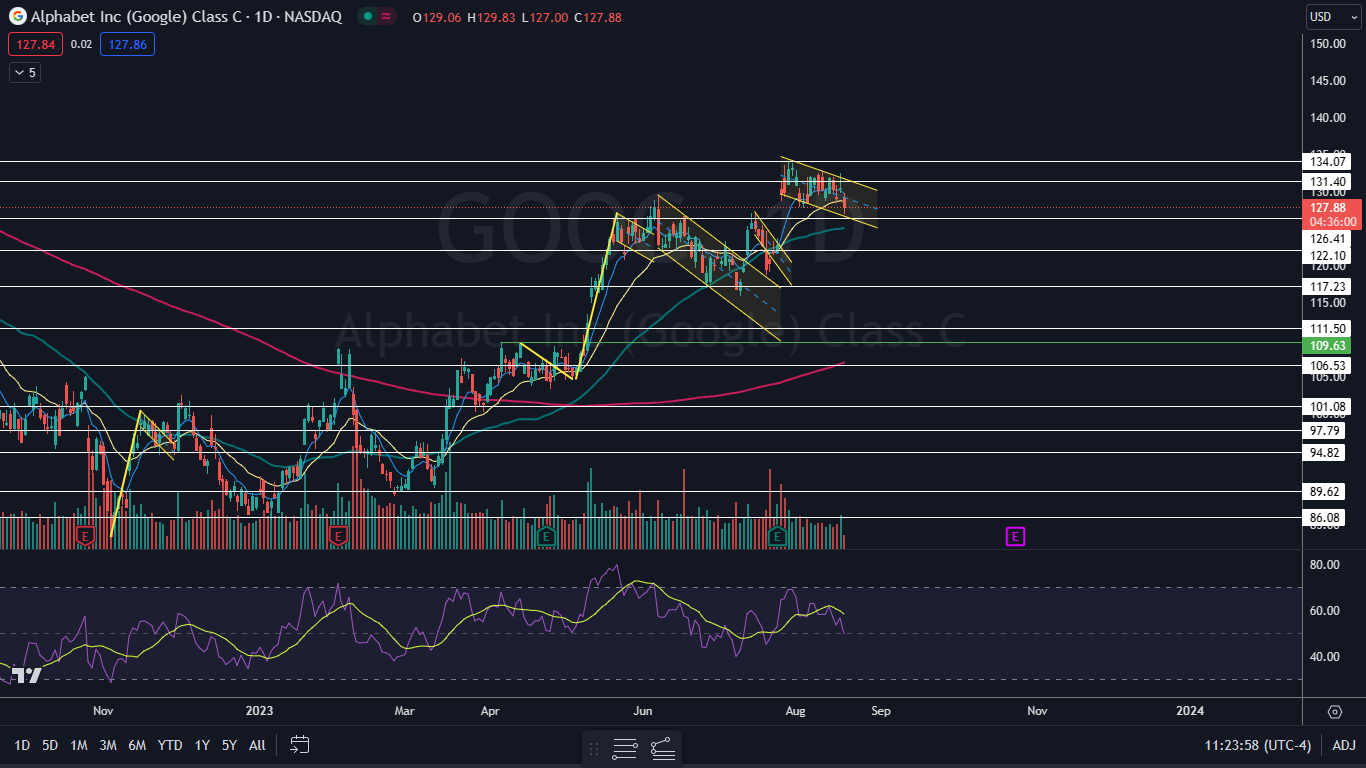
After reaching its low-of-day, Alphabet bounced up from the lower descending trend line of a falling channel pattern, indicating the pattern is recognized. The pattern is bearish for the short term but can be bullish down the road.
For bearish traders, the "trend is your friend" (until it's not) and the stock is likely to continue downwards. Aggressive traders may decide to short the stock at the upper trendline and exit the trade at the lower trendline.
Bullish traders will want to watch for a break up from the upper descending trendline, on high volume, for an entry. When a stock breaks up from a descending channel, it's a powerful reversal signal and indicates a rally is likely in the cards.
Google’s weakness, which came in tandem with other companies considered FAANG stocks, caused volatility in the stock market to spike higher. Traders wishing to play the further potential volatility in the stock market can use MIAX’s SPIKES Volatility products. The products, which are traded on SPIKES Volatility Index SPIKE, track expected volatility in the SPY over the next 30 days.
Want direct analysis? Find me in the BZ Pro lounge! Click here for a free trial.
The Alphabet (GOOG) Chart: Alphabet started to trade in a falling channel pattern on July 26, and within the formation, the stock has formed a series of lower highs and lower lows as it trends lower in a downtrend. The most recent lower high was formed on Thursday at $142.39 and the most recent confirmed lower low was printed at the $128.46 mark the day prior.
- On Friday, Alphabet tested the lower descending trend line of the channel and bounced up from the level, which was a likely scenario. If Alphabet continues to bounce on Monday, Friday’s low-of-day will serve as the next lower low within the downtrend.
- Bullish traders want to see big bullish volume come in and break Alphabet up from the falling channel pattern, which could indicate a long-term rebound is on the horizon. Traders can gauge that the pattern was recognized if the upwards break comes on higher-than-average volume.
- Bearish traders want to see the upper trend line of the channel continue to act as resistance. Bearish traders looking to enter a short position can watch for Alphabet to potentially form a bearish reversal candlestick, such as a doji or shooting star candlestick at the upper trend line.
- Alphabet has resistance above at $131.40 and at $134.07 and support below at $126.41 and at $122.10.
Image sourced from Shutterstock
Edge Rankings
Price Trend
© 2025 Benzinga.com. Benzinga does not provide investment advice. All rights reserved.
Trade confidently with insights and alerts from analyst ratings, free reports and breaking news that affects the stocks you care about.
 Read Next: