We are currently witnessing an unexpected era of the stock market where despite increasing interest rates and fears of a recession, the stock market is rallying, which may seem confusing. One key metric to understand this is the Price to Earnings or P/E ratio. It tells us how much investors are willing to pay for a company’s future earnings. A high P/E ratio means investors expect higher future earnings, showing confidence in the market’s long-term potential. Even with rising interest rates, strong company prospects can outweigh concerns, leading to a positive market outlook. So, a high P/E ratio can indicate a market that’s optimistic about the future, even in uncertain times and conversely, a low P/E ratio indicates the market’s apprehension of the times ahead
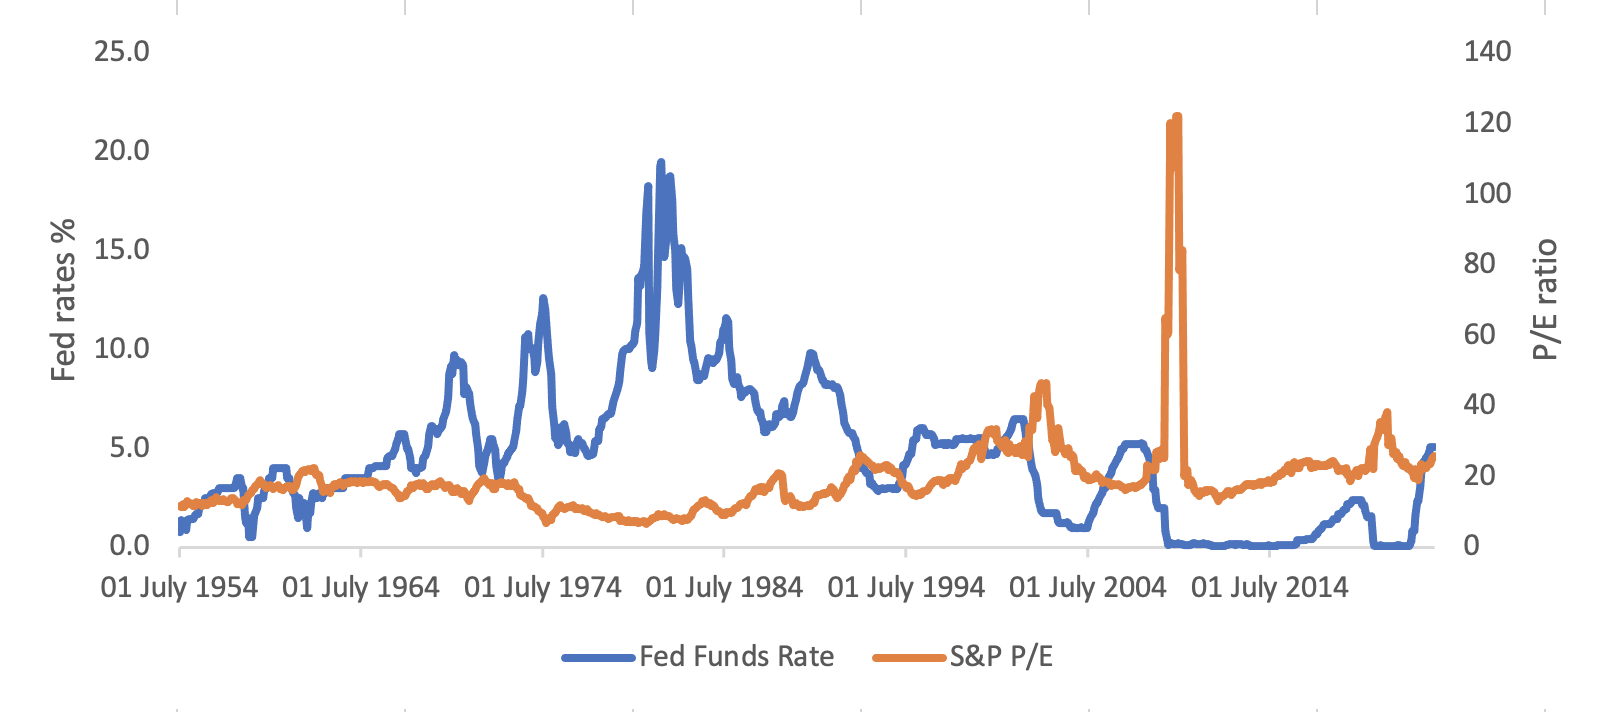
Source: Yahoo Finance
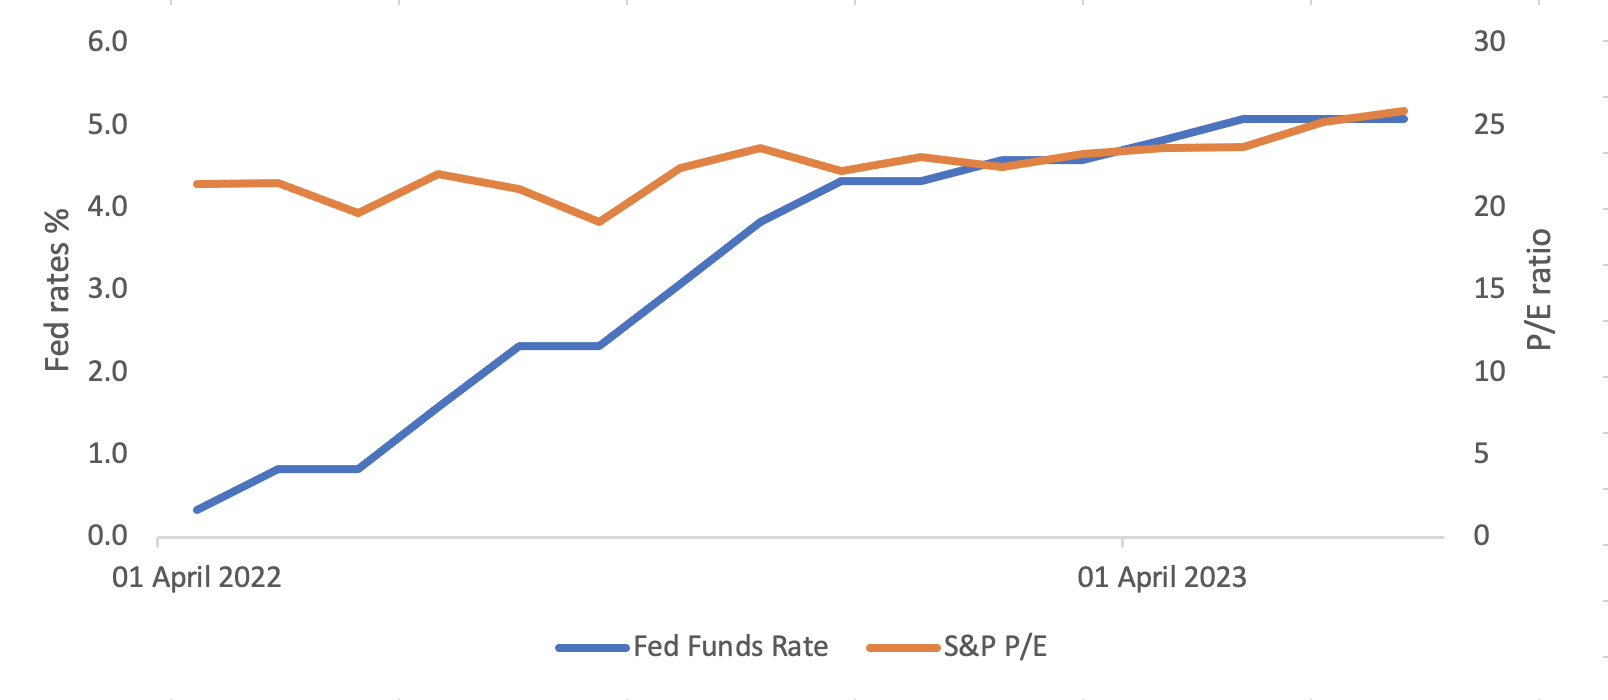
Historically, P/E ratios have demonstrated an inverse relationship to interest rates. Basically, if the interest rates are high then it becomes more costly for businesses to borrow for expansion and growth which results in weaker future earnings prospects and hence reducing the P/E ratio of the company and vice-versa. Given recent interest rate hikes and expectations for the Federal Reserve to hold or continue to increase rates, at least in the short-term, P/E ratios should have declined. But in the past few months, we have seen the P/E ratio increase with increasing interest rates.
To understand their relationship with data, we ran a model on Federal Funds rates (rates that determine the rate of interest consumers and businesses get on borrowing) and the S&P 500 stock index’s P/E ratios from July 1954 until July 2023. Further to theoretical reasoning, the model showed a negative relationship between the Fed Funds rate and S&P 500’s P/E ratio. According to the results, the expected S&P P/E ratio in July 2023 should have been 18.5 but it was 26.
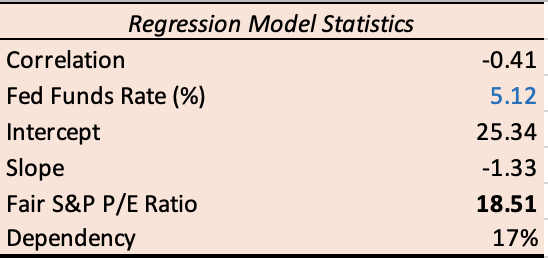
Now, let’s examine historical evidence to confirm the relationship we derived:
1. During the 1980s and 1990s, we saw a period of Fed Funds rate decline and subsequently, growth in S&P’s P/E multiple depicting an inverse relation among the two.
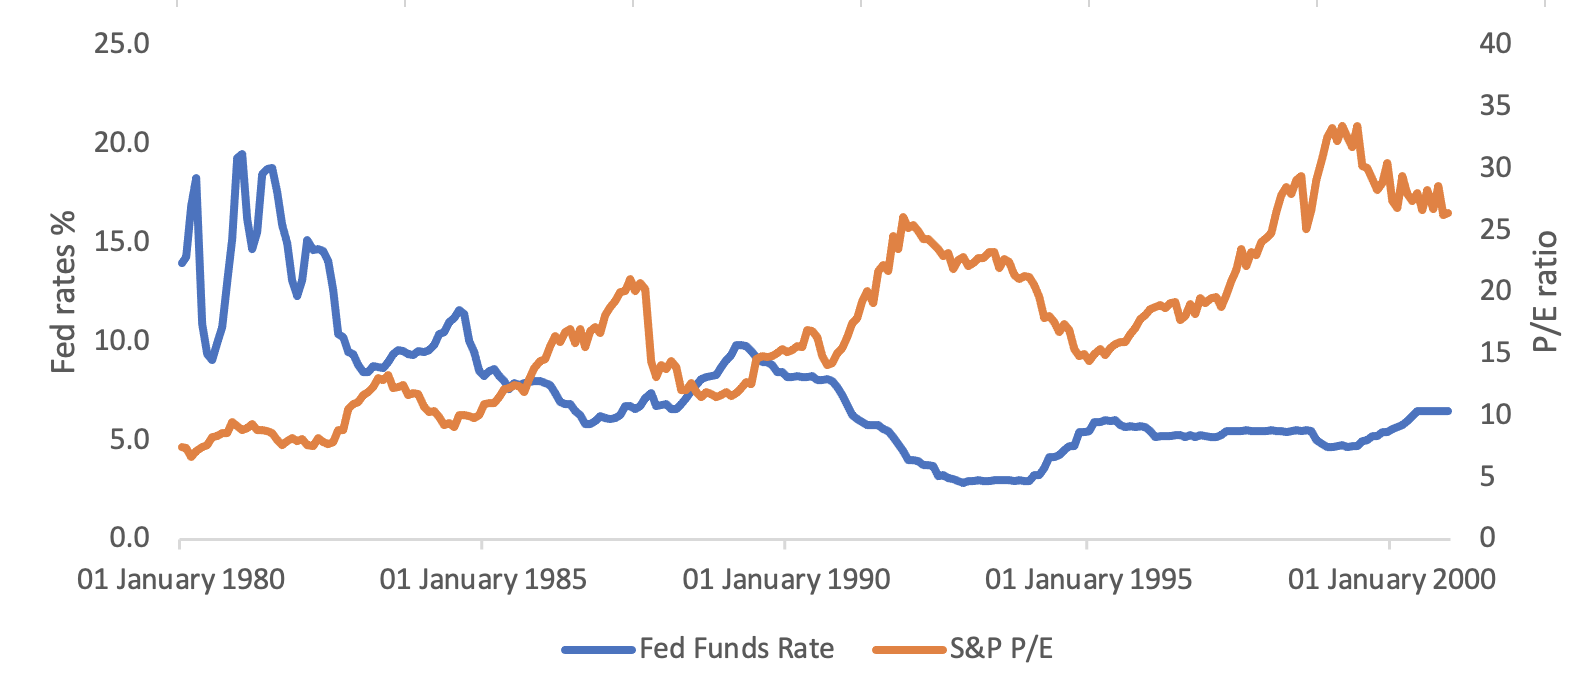
Source: Yahoo Finance
2. In the early 2000s, as the Fed began reducing rates in response to economic slowdowns, the P/E ratio surged to around 45 further adding to their negative relationship.
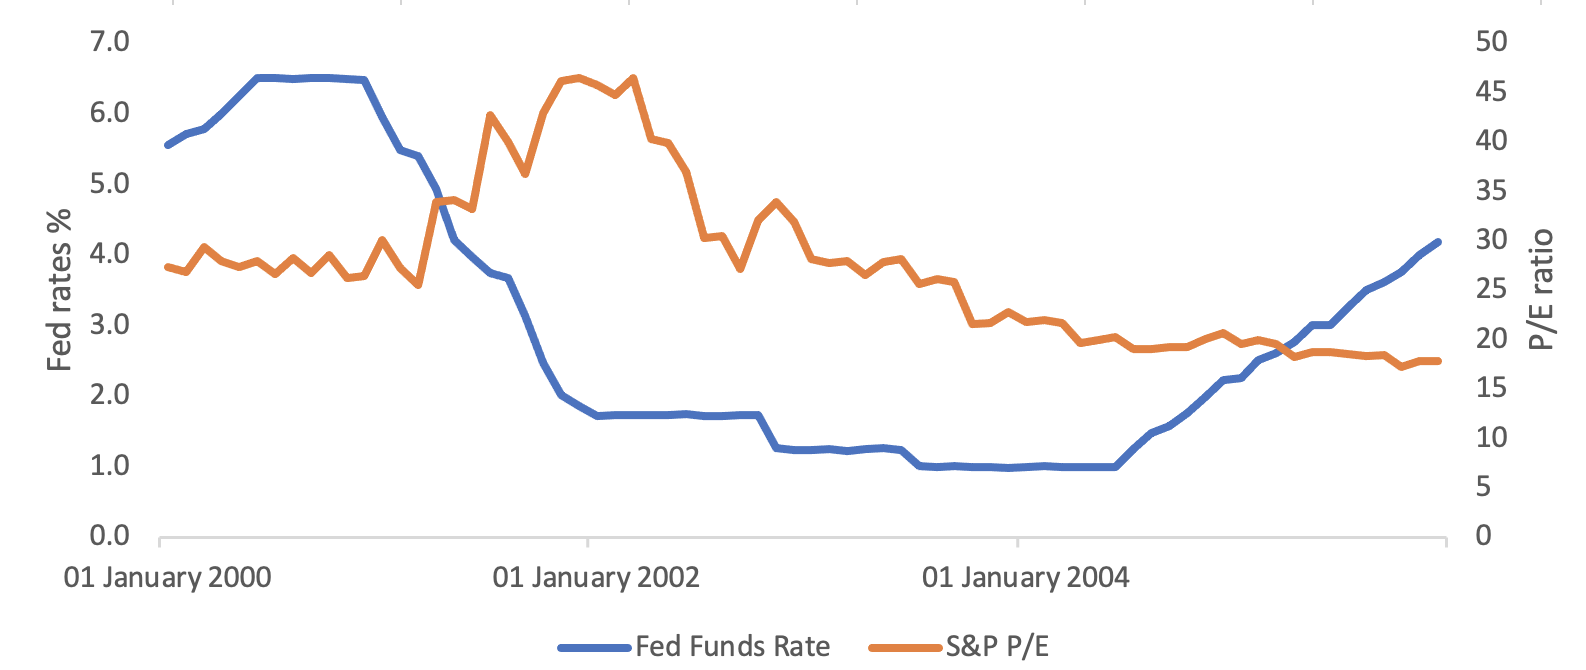
Source: Yahoo Finance
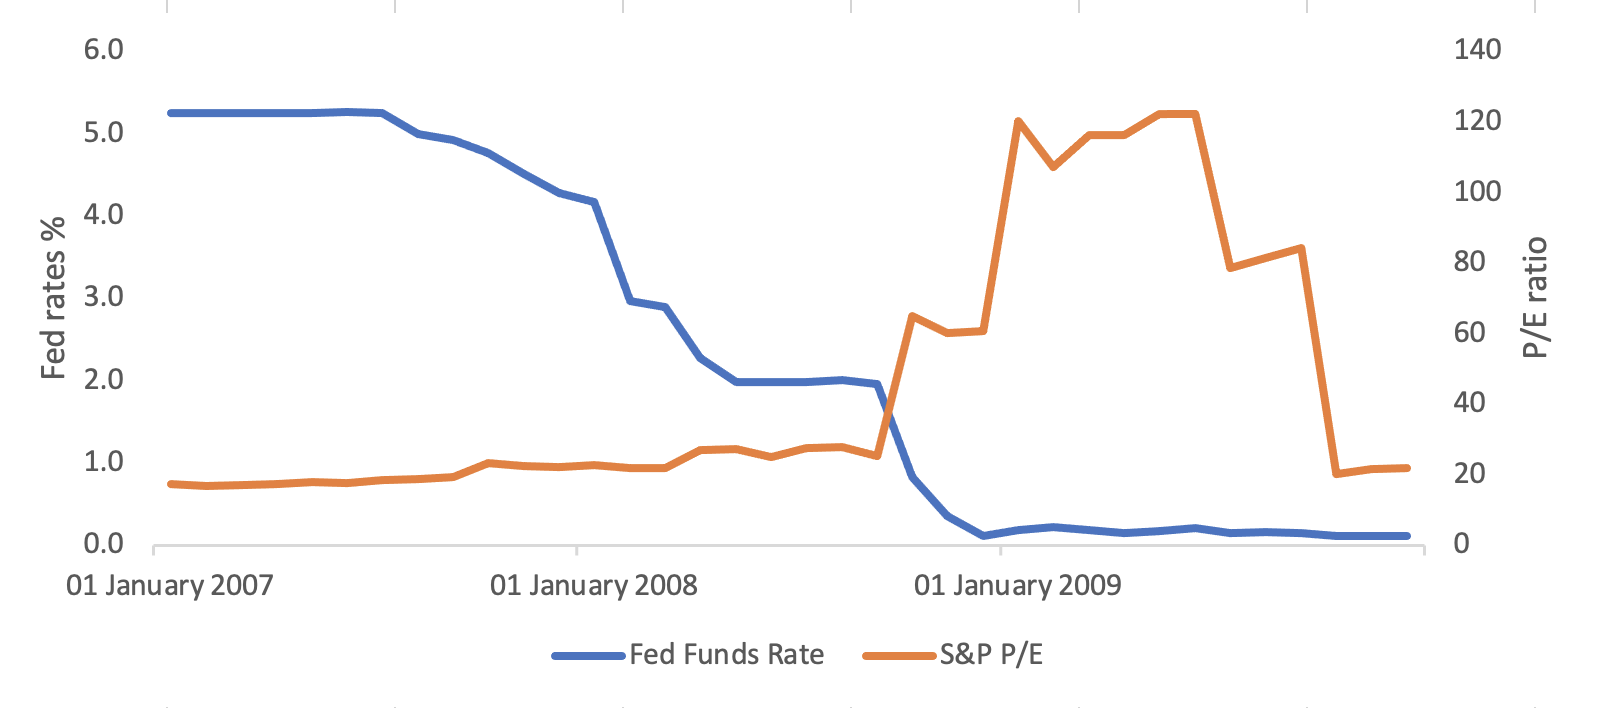
3. Leading up to the financial crisis of 2008, the Fed lowered rates dramatically, pushing the P/E ratio above 50.
Source: Yahoo Finance
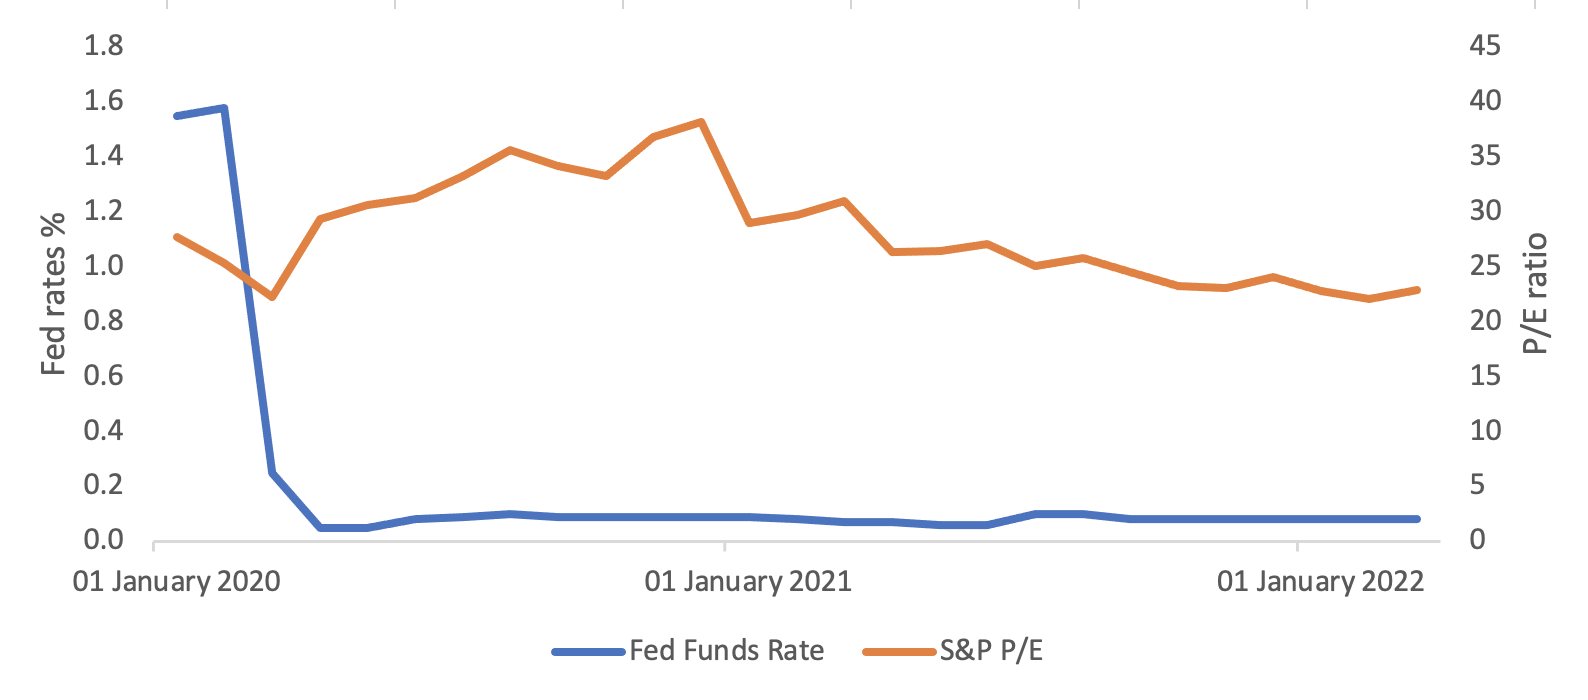
4. In the recent era of ultra-low interest rates, the S&P 500 P/E ratio climbed to historically high levels, surpassing 30 at times.
Source: Yahoo Finance
All this evidence confirms the inverse relationship between the two. But, more recently, the two have moved in the same direction as if they were positively correlated.
Source: Yahoo Finance
To understand what it means for the markets and hence, the investors we are now going to forecast S&P P/E Ratio and S&P 500 levels:
We assume the Fed Funds rate for the future and based on results from our model we expect the following changes in S&P 500 P/E ratios and S&P 500 levels :

* Predicted
On the basis of the Fed Funds rate, as we can see, as of July 2023 the S&P 500 is overvalued by 36% based on the historical relationship and this could be the case in the future as well. It means that there might be a market correction in the future, hence the US stock market will go down. Fortunately, there are many strong points in the economy that tell us that the market downfall will not be drastic such as:
- Robust GDP Growth: The U.S. economy continues to showcase strong performance with a notable GDP growth rate of 2.4% in Q2 vs 1.6% in Q1. This sustained economic expansion signifies resilience and potential opportunities for businesses and investors alike.
- Easing Inflation: Inflation, a critical factor impacting investment decisions, has shown signs of easing with a year-on-year rate of 3% in June 2023 vs 6% a year before. A controlled inflation rate instills confidence in the stability of prices, enabling businesses to plan and consumers to make informed purchasing decisions.
- Strong Labor Market: The labor market’s strength is evident, as indicated by the 60.3% employment rate as of June 2023. A strong labor market typically leads to higher wages, reduced unemployment, and increased consumer spending, fostering a positive economic environment.
- Resilient Consumer Spending: The U.S. economy benefits from consumer spending remaining in the 1+ territory, showcasing a consumer base willing and able to contribute to economic growth. A robust consumer spending trend reflects consumer optimism and financial well-being, contributing significantly to overall economic health.
We at Alphanso believe that the high-interest rate environment is here to stay until the Fed achieves the target of 2% inflation about which Federal Reserve Chairman, Jerome Powell, after the board meeting of July 2023, said that they do not expect to achieve the target until at least 2025.
In Conclusion
Considering these factors, investors seem to believe that the U.S. market possesses the potential to live through the challenges posed by a high-interest rate environment. The interplay of favorable GDP growth, easing inflation, a tight labor market, and strong consumer spending all work together to instill faith in the nation’s economic future.
However, it’s essential to monitor how these factors evolve to make well-informed investment decisions amid changing economic conditions. What you should pay attention to is how you are financially prepared for such situations and how you can safeguard and grow your money by creating an optimal portfolio based on your needs and market dynamics.
© 2025 Benzinga.com. Benzinga does not provide investment advice. All rights reserved.
Trade confidently with insights and alerts from analyst ratings, free reports and breaking news that affects the stocks you care about.