The Markets
The market remains anxious over all the same factors:
- War
- Inflation
- Recession
- Interest rates/yields
In Monday’s article, it was pointed out that the earnings from some of the M7 would have a significant impact on the market. The reports are out and slower earnings growth and tepid guidance have been added to the list above.
Alphabet Inc. GOOGL, Meta Platforms, Inc. META, and Microsoft Corporation MSFT are all down. (MSFT did gap higher and stay for one day, but it’s lower now.) Amazon.Com, Inc. AMZN just reported. The initial reaction is higher. But it doesn’t look especially strong.
5 of the Magnificent 7 have announced. Only AAPL (Nov. 2) and NVIDIA Corporation NVDA (Nov. 21) remain. But all 7, who have largely been hailed as holding the market up, are well off their highs.
The indexes have started to break down in a meaningful way. And selloffs create opportunity.
Magnificent 7 Charts
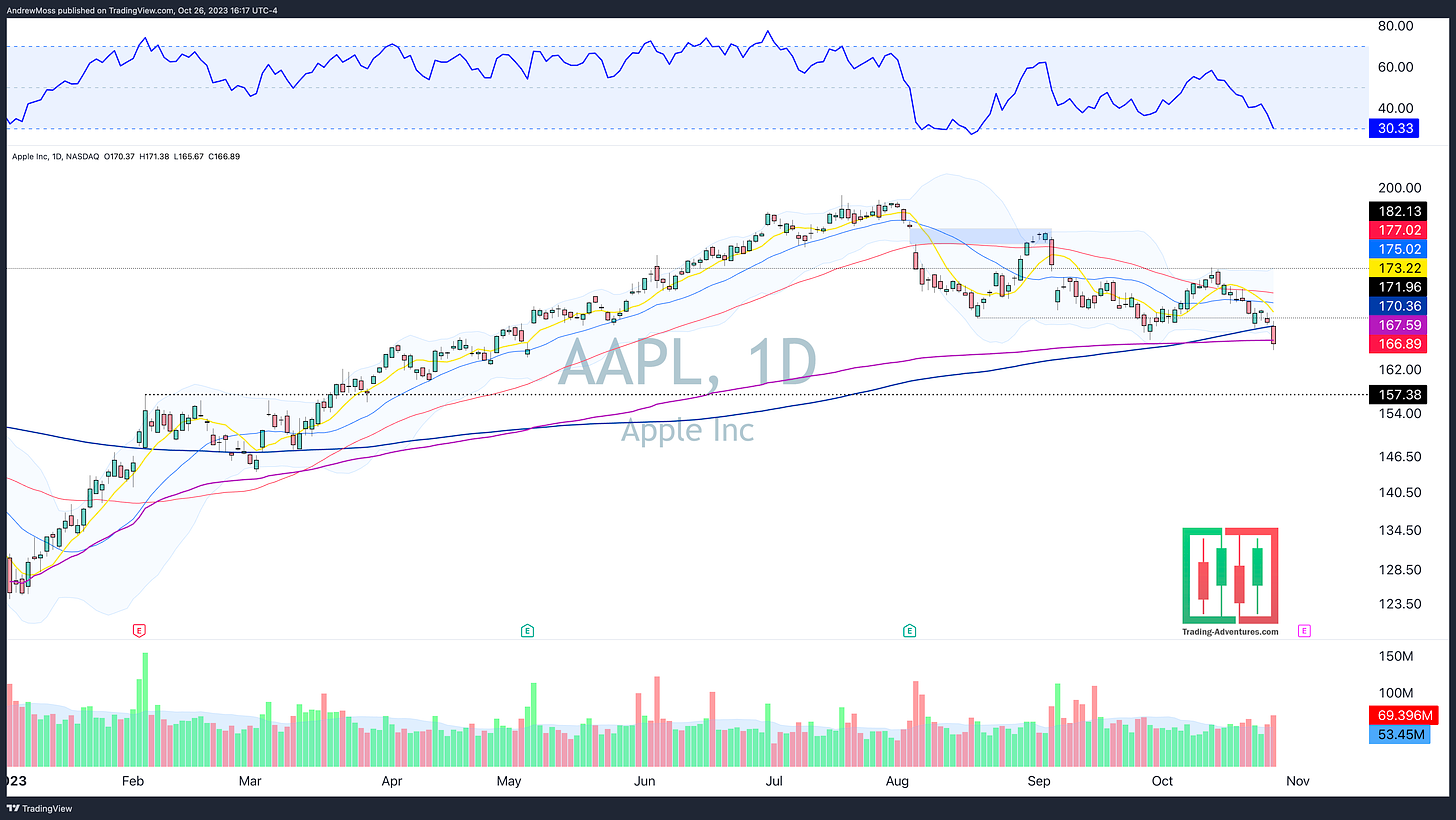
AAPL is -16% off its high, below all the key moving averages, and the year-to-date anchored volume weighted average price, though it did try to defend that level going into the close.
There is a pivot high from the February earnings report at $157.28.
AMZN is -18% lower. Only the 200-day MA and YTD AVWAP are below the price before earnings. It’s up in after-hours trading. And it also has a pivot high from the February earnings to watch - $114.
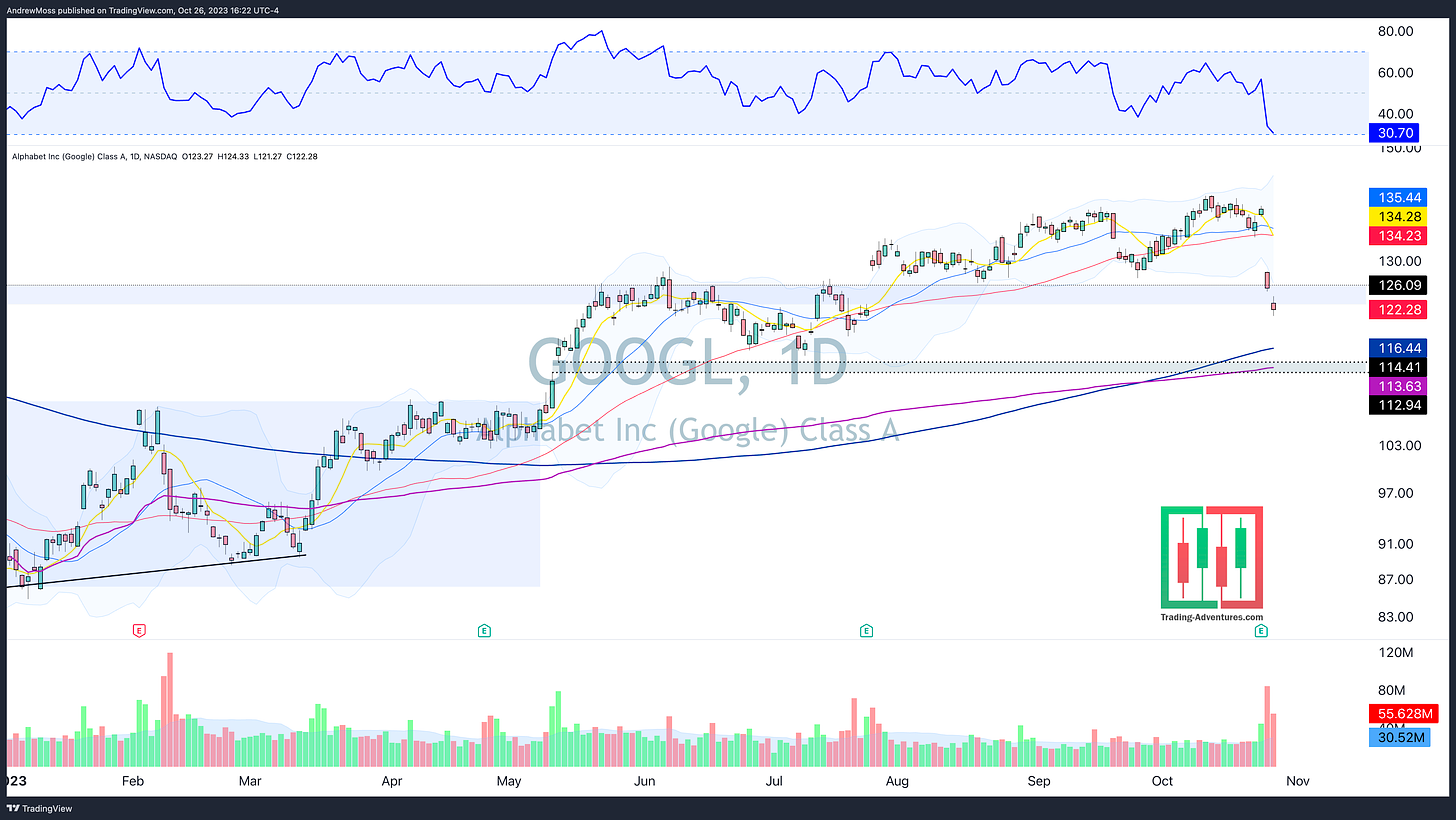
GOOGL saw its high price more recently than all but one other M7 stock and is now quickly catching up (down?). It’s -14% lower now and into a support/resistance area that dates back to June ‘21.
Further below there is a gap near the YTD AVWAP - $113s to $114s.
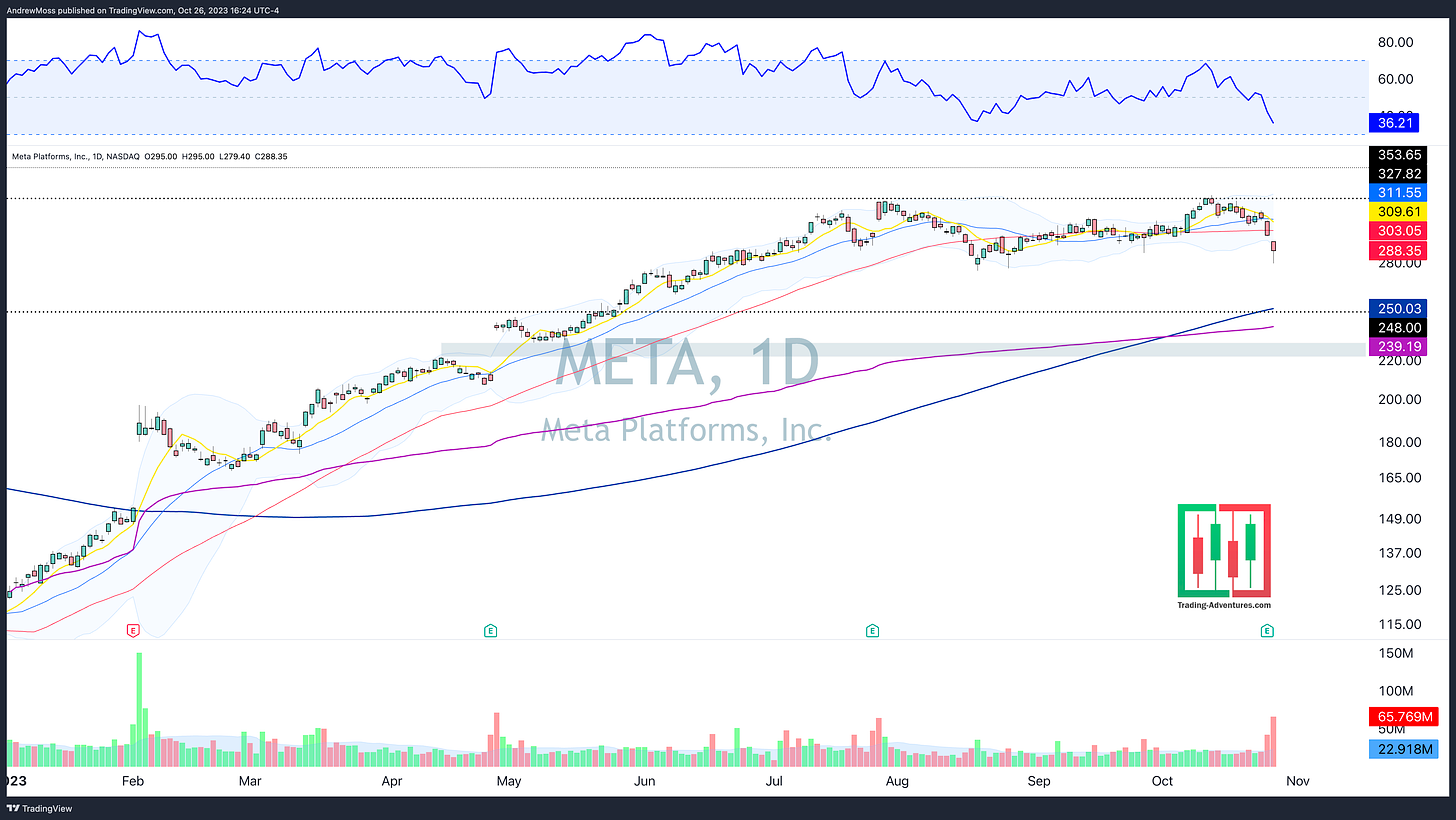
META made its high on the same day as GOOGL, Oct. 12. It is lower by -15% since then. The 200-day MA and a pivot level from February ‘22 are near $248-$250.
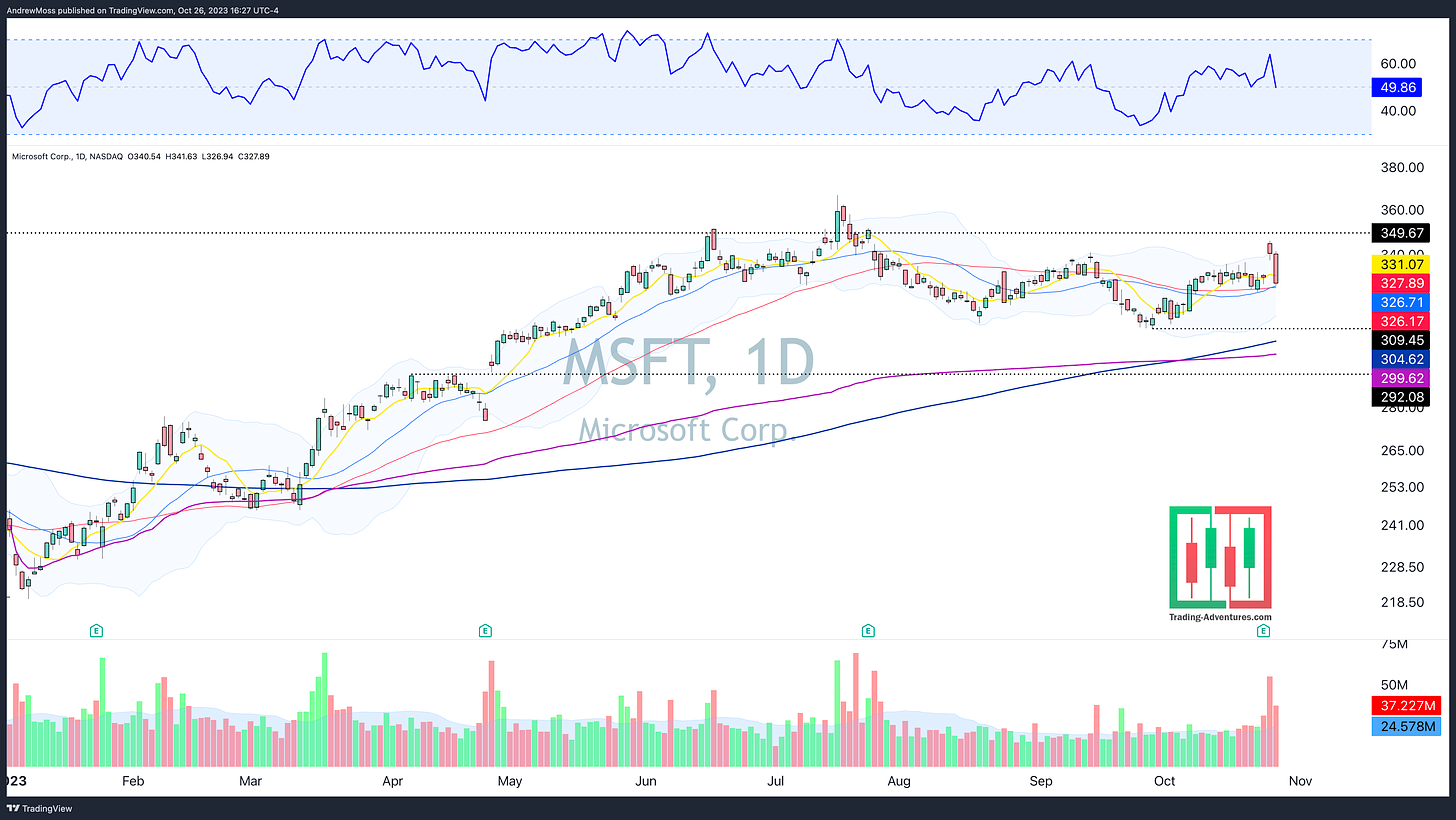
MSFT shows relative strength compared to the others. It’s -10% lower from the highs when it briefly popped over the previous highs made in Nov. ‘21. It still has the 21, 50, and 200-day MAs underneath. There is also a pivot low at $309.45
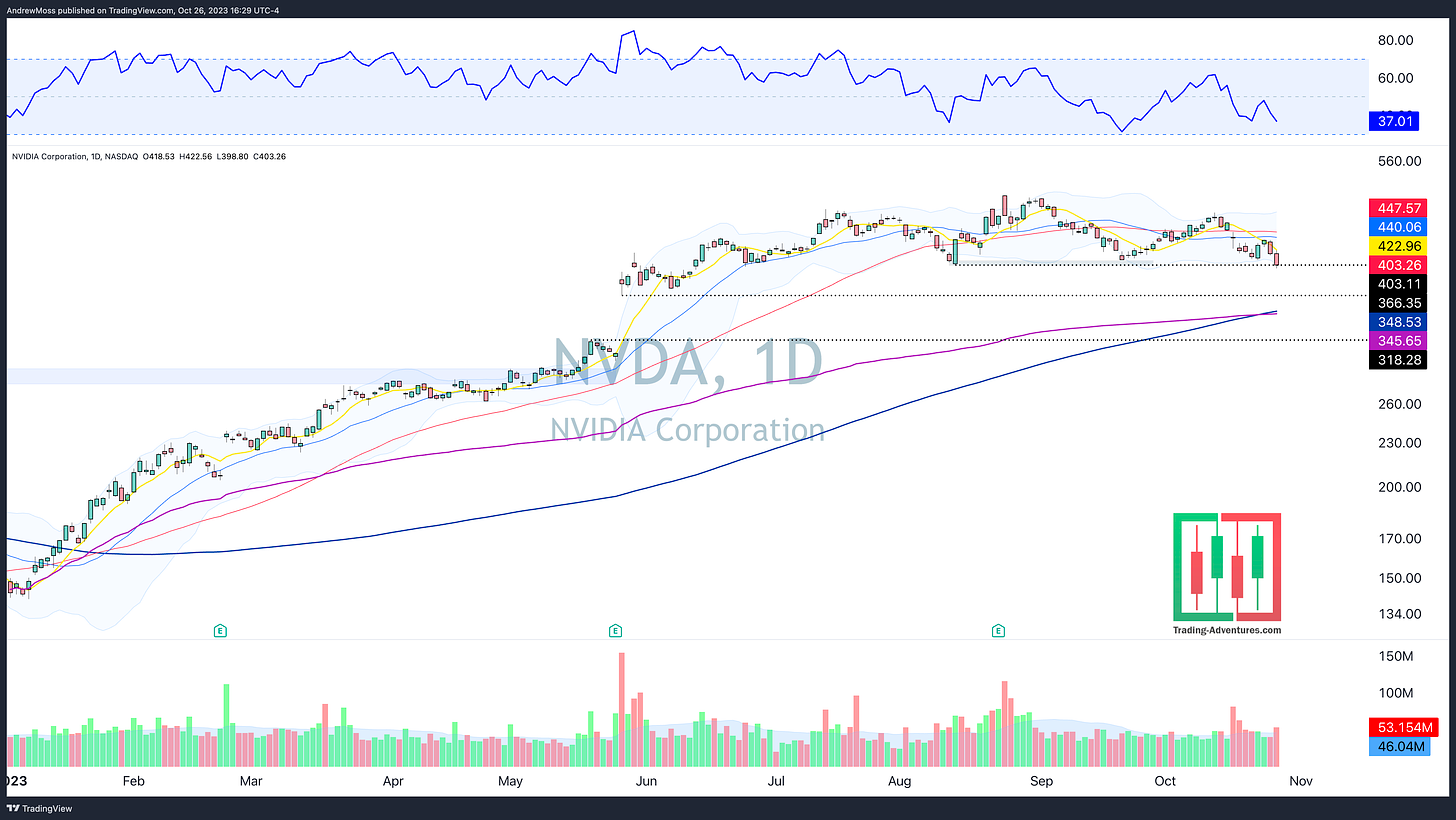
NVDA is -20% lower now and broke the psychologically important round number, $400 before coming back to close just barely above the $403.11 pivot. Beneath there is another pivot at $366s, followed by the 200-day MA and YTD AVWAP - $348.53 and $345.65. Finally, there is a gap fill at $318.28.
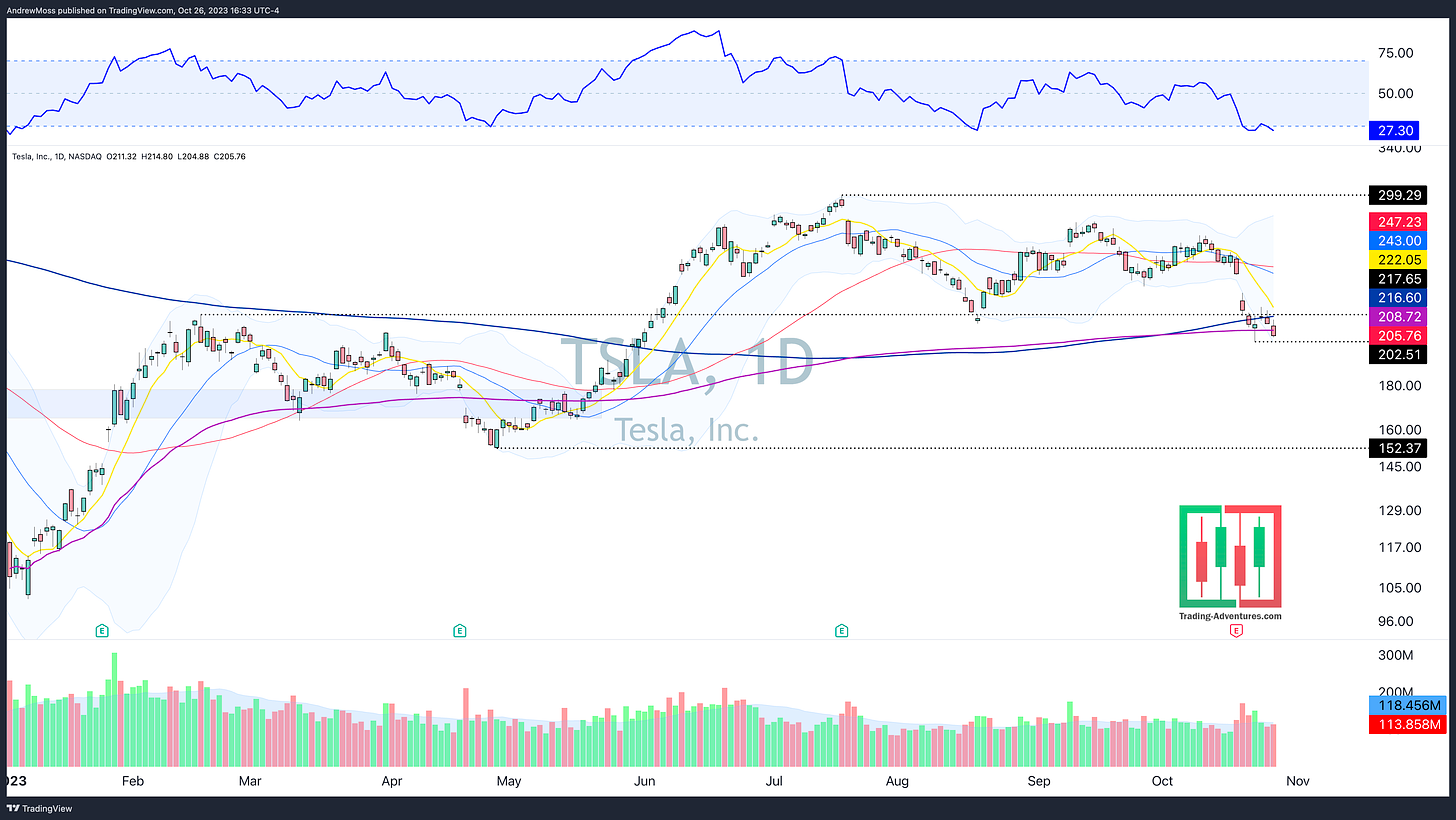
TSLA is a little above its low, made this past Monday (now a $202.51 pivot), but is still down more than -30% from the highs. It’s also below all the key MAs and YTD AVWAP. The chart doesn’t show any potential support below Monday’s $202.51 pivot until all the way down to $152.37.
Not a very bullish view for the Magnificent 7.
On the opportunistic side, once the leaders have been sold off as well, the market is a step closer to finding a bottom.
From here we will be left trying to determine,
- Is this a run-of-the-mill market correction?
- Or is it the start of something bigger?
The Charts
- SPDR S&P 500 SPY is now below all the important technical levels we’ve been watching. Is this flush enough?
- Can we see a failed breakdown?
- Can prices quickly regain $417? which is roughly equivalent to $SPX $4200.
If not, $403.78 is the next potential support.
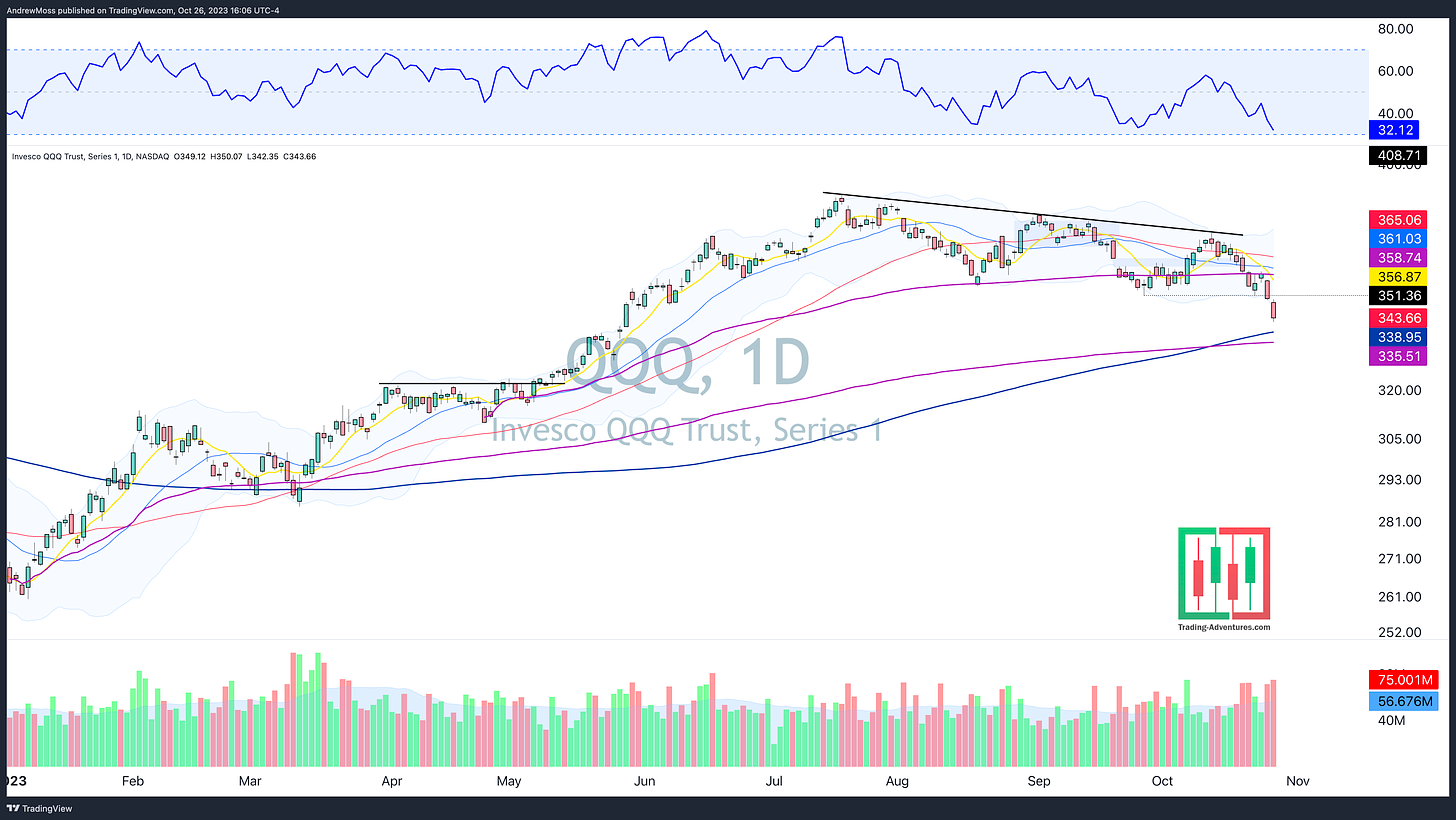
Invesco QQQ Trust, Series 1 QQQ The 200-day MA - $338.95 may be a magnet now. Followed by the YTD AVWAP at $335.51.
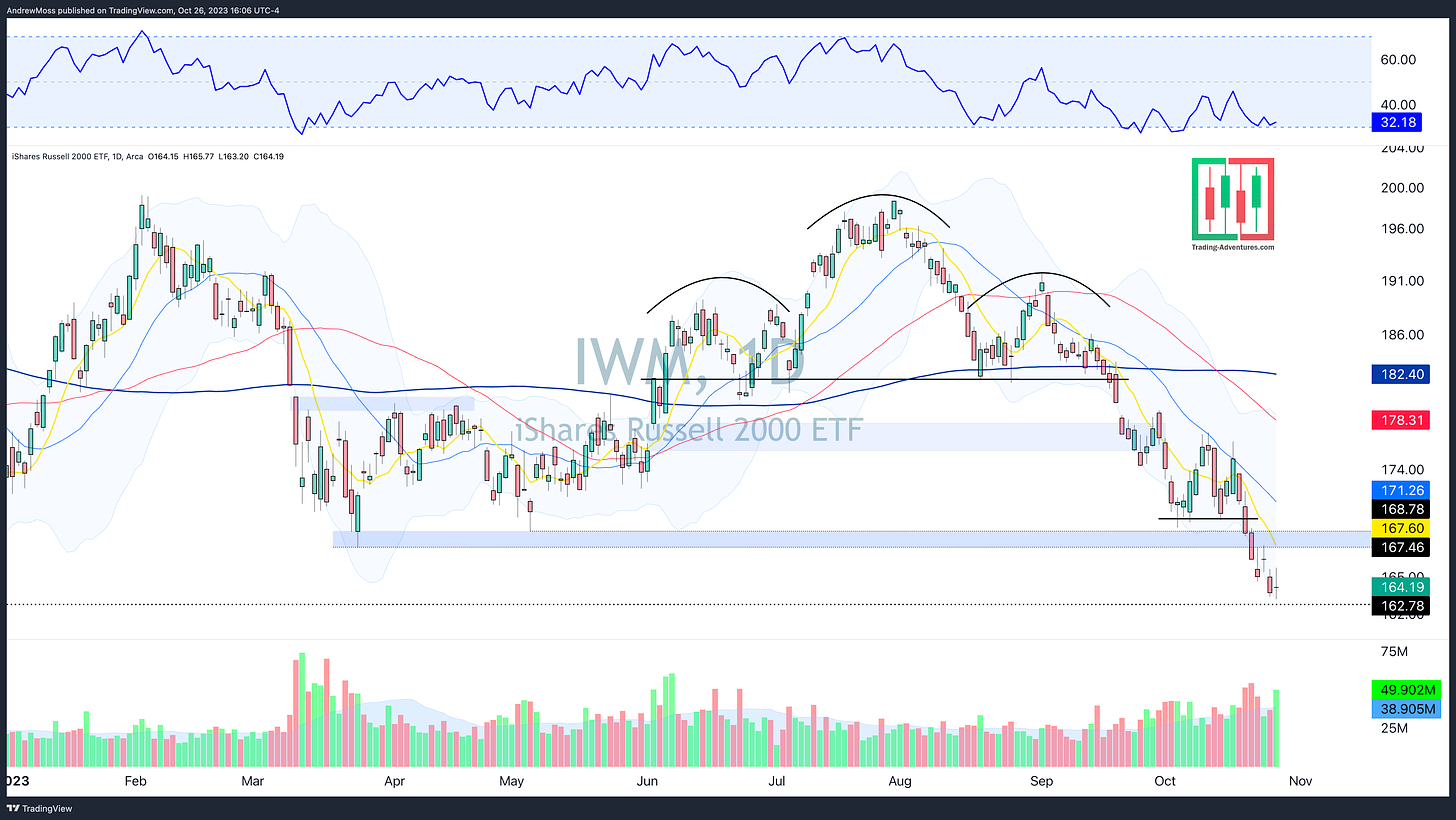
IShares Russell 2000 ETF IWM is near the pivot low made in June 2022. The next potential support is at the $162.78 pivot June ‘22.
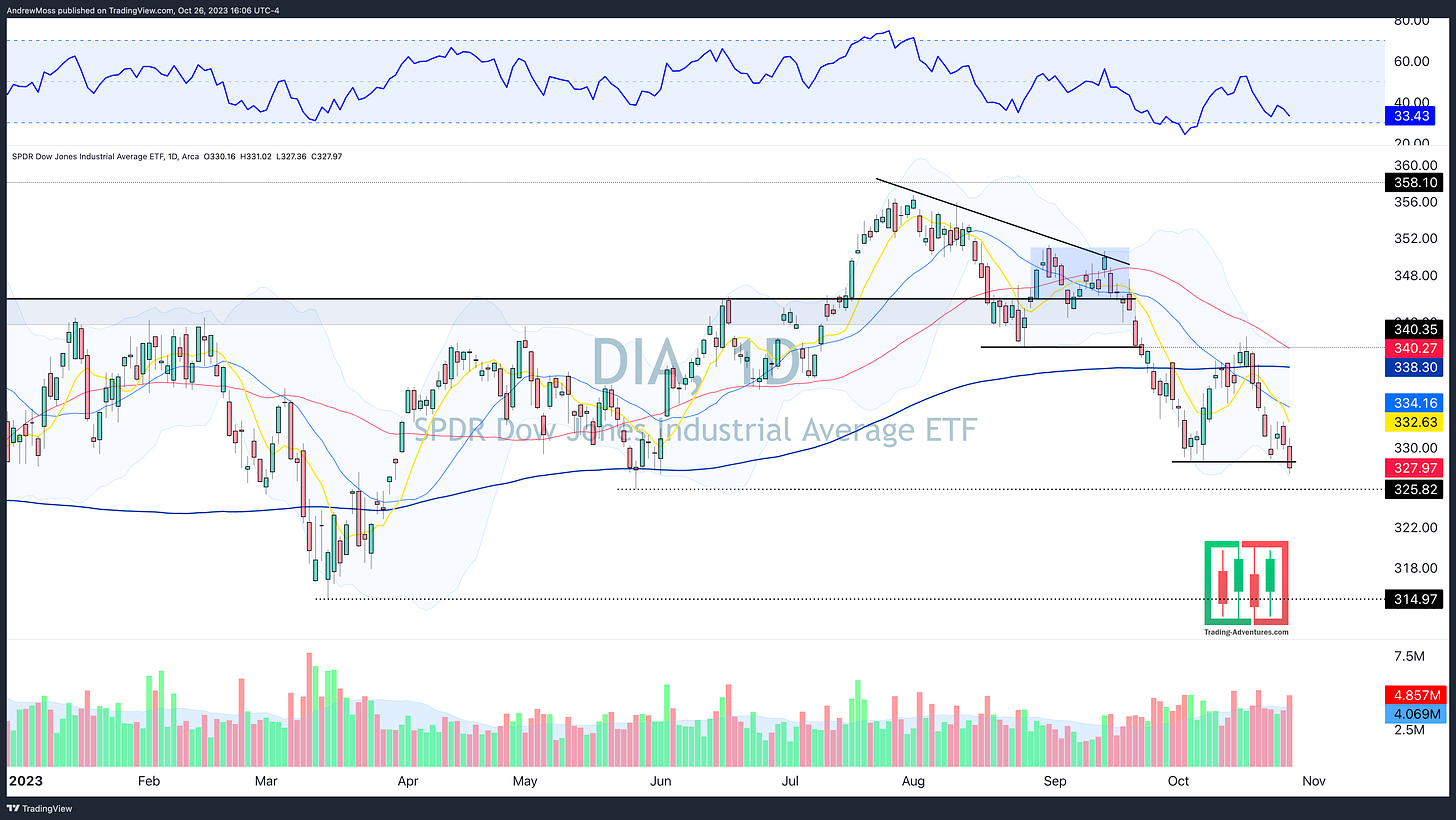
SPDR Dow Jones Industrial Average ETF DIA is below the lows of recent weeks. Below that, pivots at $325s and $315.
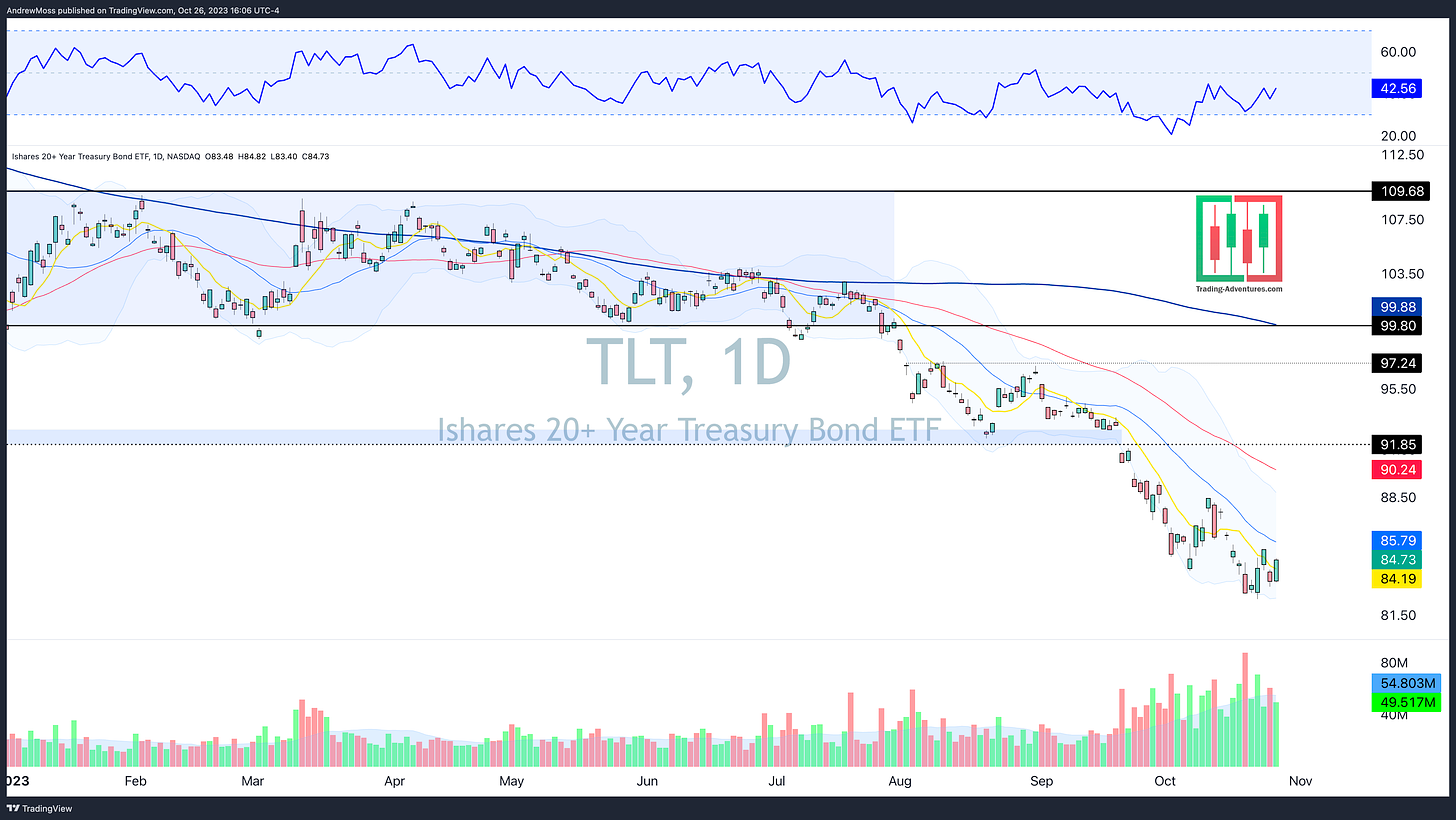
IShares 20+ Year Treasury Bond ETF TLT was green on the day, closing above the 8-day MA. It needs a close over the 21-day to make a bolder statement.
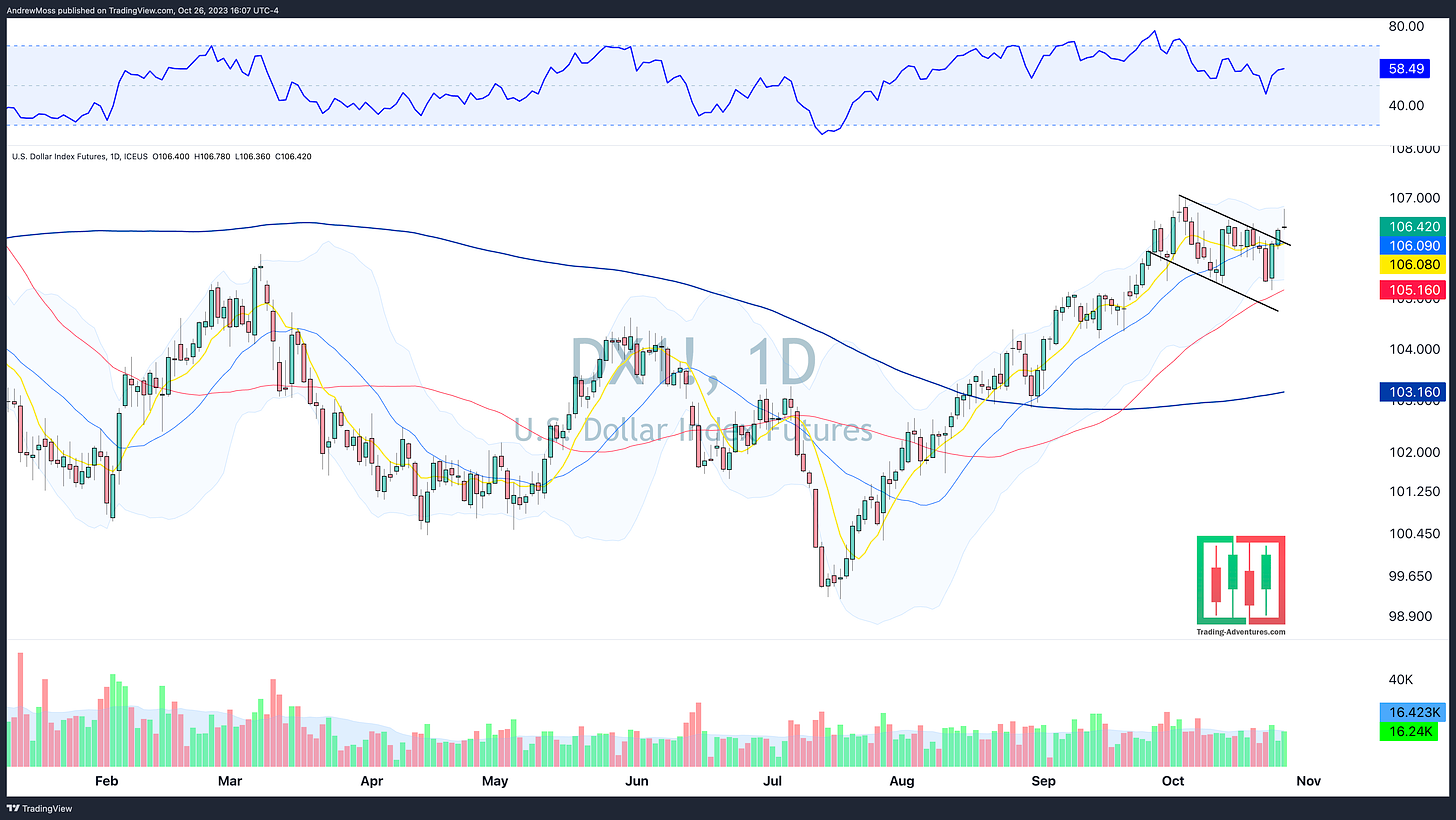
DXY The Dollar broke higher from a bull flag formation. Not the move stocks wanted to see. But it did lose steam in the later part of the day.
The Closing Bell
The selling is here and may be building steam. Hoping for a failed breakdown in SPY, while possible, is not a good strategy.
Looking at the bigger currents, Jeff Hirsh (Stock Trader’s Almanac) points out that October has a reputation for producing market bottoms. He says,
"Buy in October and get your portfolio sober."
It’s true, Seasonality shows the best six months of the year start next week. We’ll find out soon if the historical tendencies are stronger than the current fears and factors.
In the meantime, continue to follow price action first, and indicators after.
As we know, only price pays.
The Disclosures
***This is NOT financial advice. NOT a recommendation to buy, sell, or trade any security. The content presented here is intended for educational purposes only.
Andrew Moss is an associated member of T3 Trading Group, LLC (“T3TG”) a SEC registered broker/dealer and member of FINRA/SIPC. All trades placed by Mr. Moss are done through T3TG.
Statements in this article represent the opinions of that person only and do not necessarily reflect the opinions of T3TG or any other person associated with T3TG.
It is possible that Mr. Moss may hold an investment position (or may be contemplating holding an investment position) that is inconsistent with the information provided or the opinion being expressed. This may reflect the financial or other circumstances of the individual or it may reflect some other consideration. Readers of this article should take this into account when evaluating the information provided or the opinions being expressed.
All investments are subject to the risk of loss, which you should consider in making any investment decisions. Readers of this article should consult with their financial advisors, attorneys, accountants, or other qualified investors prior to making any investment decision.
POSITION DISCLOSURE
October 26, 2023, 4:00 PM
Long:
Short:
Options symbols are denoted as follows:
Ticker, Date, Call/Put, Strike Price
Example: VXX1218C30 = VXX 12/18 Call with a $30 strike
© 2025 Benzinga.com. Benzinga does not provide investment advice. All rights reserved.
Trade confidently with insights and alerts from analyst ratings, free reports and breaking news that affects the stocks you care about.
