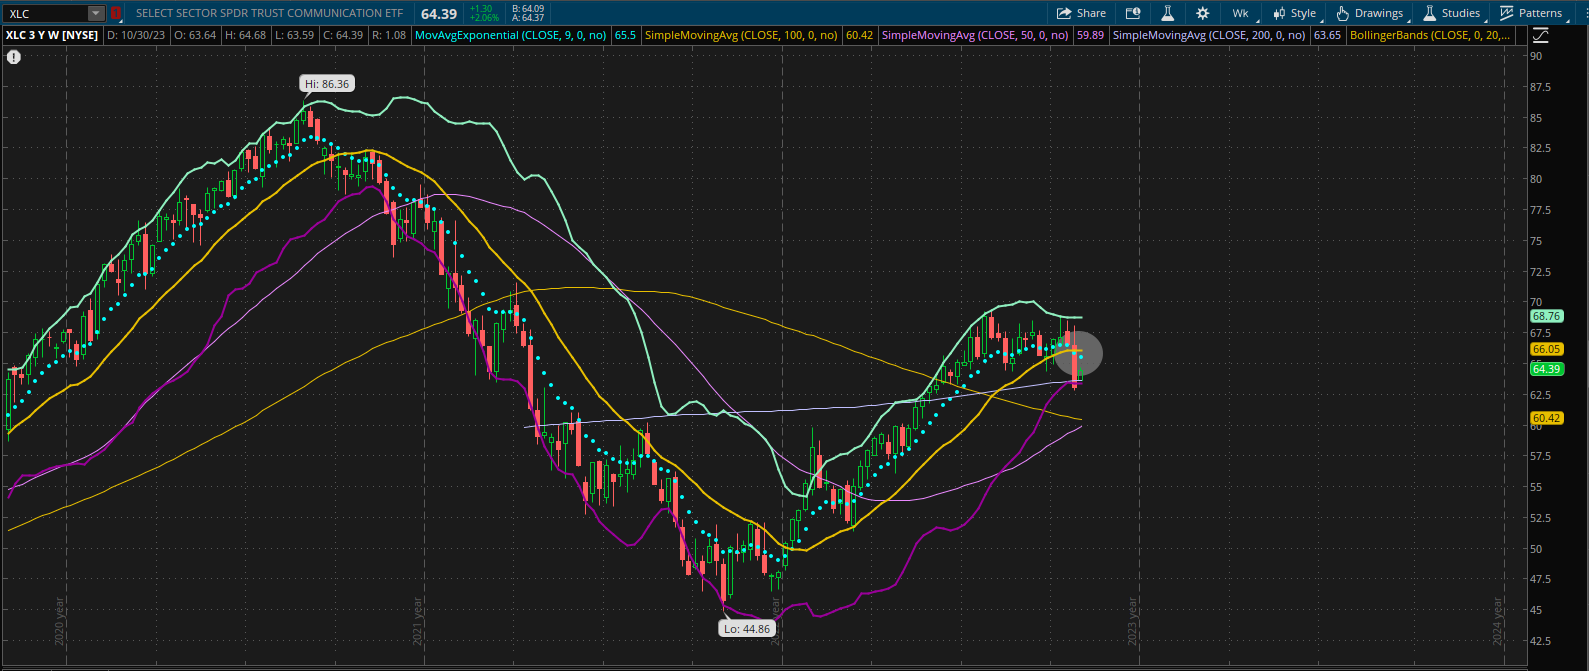
Are we in a bull market, or did we just finish one of the largest bear market rallies since the early 2000’s? Seasonality suggested the markets would dip in September and find some relief mid-late October with a large rally that leads into one of the most bullish months of the year, November. Well, the dip happened, but so far, we are still dipping. Even mainstream analysts such as Fundstrats Tom Lee (typically a mega bull) have reduced his end-of-year target for the S&P 500. A few factors go into why we are starting to ask if we are in a bull market or if we just experienced an insane bear market rally in the first three quarters of 2023. For starters, the fundamental issue (inflation) that began the initial decline in 2022 has drastically improved, BUT as data has shown, we are still in the woods. CPI and PCE data show inflation is slowly creeping back up; retail sales show a strong consumer and let's not even get started with the most recent GDP print for Q3. Yields and corporate bonds are way out of wack and show no signs of stabilizing. However, the bond market is assisting the Fed in its fight against inflation.
Fundamentals aren’t the only indicators waiving red flags; the technicals are just about as bad, if not worse, subjectively speaking. One could argue the Rusell 2000 ETF IWM IWM is a measurement of risk appetite in the markets. Well, currently, IWM is contesting its low from October of last year. This would suggest the risk appetite is about as low as it was then, and the rally we’ve experienced was fueled by the Magnificent Seven and AI euphoria. Secondly, SPDR ETFs such as XLC XLC hold some of the year's best-performing stocks. In fact, XLC has outperformed all the other SPDR ETFs year-to-date, but after this past month's drawdown, the chart suggests things are just getting started. The short-term significant support of ~ 64.50 broke last week, and now the weekly 9EMA (Exponential Moving Average) has crossed under the 20 moving average on the weekly chart. If you are new to technicals and don’t quite understand, to make it simple, when a shorter time frame moving average moves under a longer time frame moving average, it’s typically a signal for a sell and vice verse. That being said, the longer the time frame this event occurs, the larger and longer the result is. Considering this is happening on the weekly time frame, we could be in for a continuation to the downside, destroying seasonal convergence. This is why we are asking if 2023 was the start of a new bull market or just an extensive bear market rally.

If you are on Twitter, now known as “X,” feel free to follow @ThrashCapital for more content!
Edge Rankings
Price Trend
© 2025 Benzinga.com. Benzinga does not provide investment advice. All rights reserved.
Trade confidently with insights and alerts from analyst ratings, free reports and breaking news that affects the stocks you care about.