


Zinger Key Points
- ARKK is working to form a bull flag pattern under the 200-day SMA.
- TARK is an actively managed 2X leveraged ETF aiming to return 200% of the daily performance of ARKK
- Feel unsure about the market’s next move? Copy trade alerts from Matt Maley—a Wall Street veteran who consistently finds profits in volatile markets. Claim your 7-day free trial now.
The Cathie Wood-led ARK Innovation ETF ARKK was slipping about 0.6% Monday on lower-than-average volume, possibly due to Coinbase Global, Inc’s COIN retracement, the latter which is the largest holding within the ARKK fund.
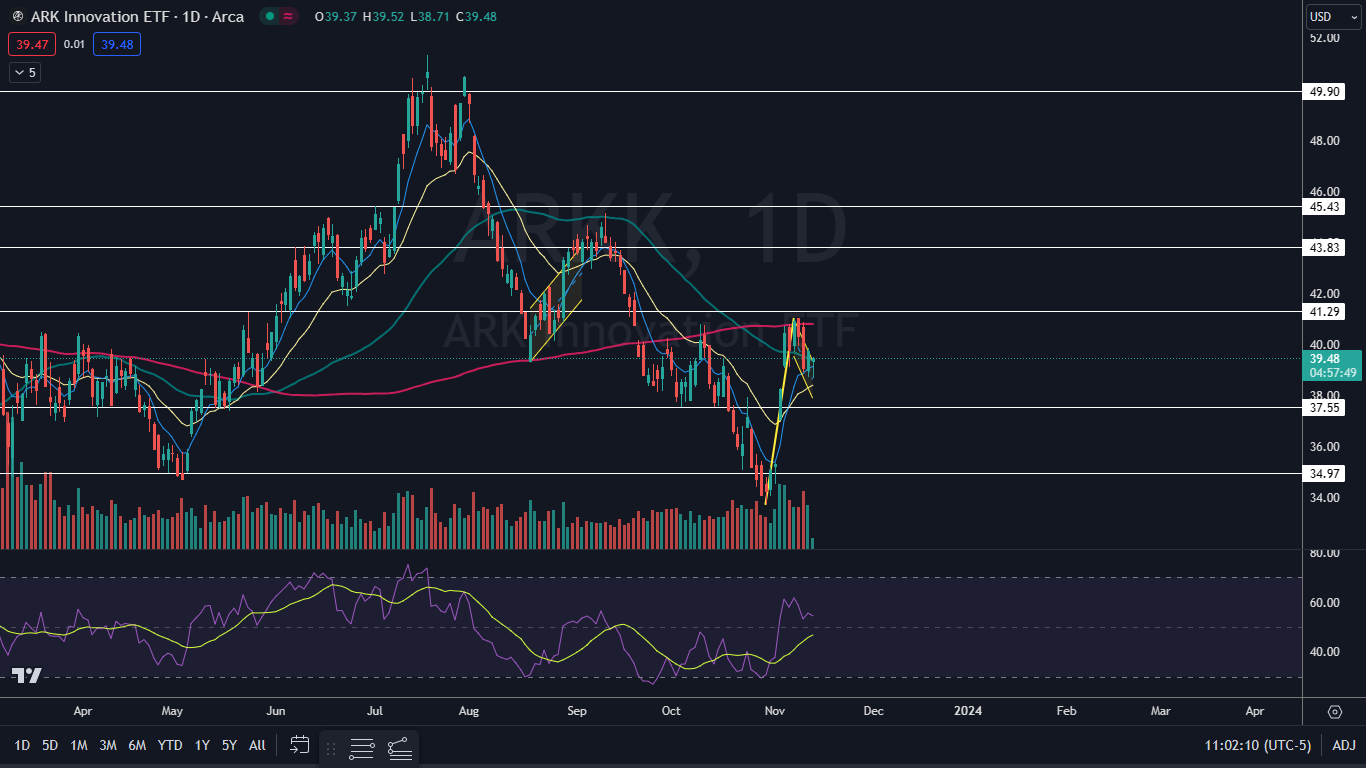
ARKK has slid almost 10% since Nov. 7, when the ETF rejected the 200-day simple moving average (SMA) as resistance and began to retrace. The retracement followed a 21% surge in ARKK between Oct. 30 and Nov. 7, however, which has settled the ETF into a possible bull flag pattern on the daily chart.
The bull flag pattern is created with a sharp rise higher forming the pole, which is then followed by a consolidation pattern that brings the stock lower between a channel with parallel lines or into a tightening triangle pattern.
For bearish traders, the "trend is your friend" (until it's not) and the stock may continue downwards within the following channel for a short period of time. Aggressive traders may decide to short the stock at the upper trendline and exit the trade at the lower trendline.
Traders looking for leveraged long exposure to ARKK may choose to play the AXS 2x Innovation ETF TARK. TARK is also forming a bull flag pattern but under the 50-day SMA.
TARK is an actively managed 2X leveraged ETF aiming to return 200% of the daily performance of ARKK and was shooting up over 6% on Tuesday.
Want direct analysis? Find me in the BZ Pro lounge! Click here for a free trial.
The ARKK Chart: The measured move of ARKK’s bull flag is about 20%, which suggests the ETF could surge up toward the $46 level in the future. Bullish traders want to see big bullish volume come in and break the ETF up from the descending trend line of the flag, which would likely cause ARKK to regain the 200-day SMA as support.
- On Monday, ARKK was working to print a hammer candlestick, which could indicate the local low has occurred and the ETF will trade higher on Tuesday. ARKK is currently battling the 50-day SMA as resistance, and bullish traders want to see the ETF close Monday’s trading session above that area.
- Bearish traders want to see big bearish volume come in and break ARKK down under the eight-day exponential moving average, which would negate the bull flag and suggest the current downtrend is the stronger pattern.
- ARKK has resistance above at $41.29 and at $43.83 and support below at $37.55 and at $34.97.
 Read Next:
 Edge Rankings
Price Trend
© 2025 Benzinga.com. Benzinga does not provide investment advice. All rights reserved.
Trade confidently with insights and alerts from analyst ratings, free reports and breaking news that affects the stocks you care about.

