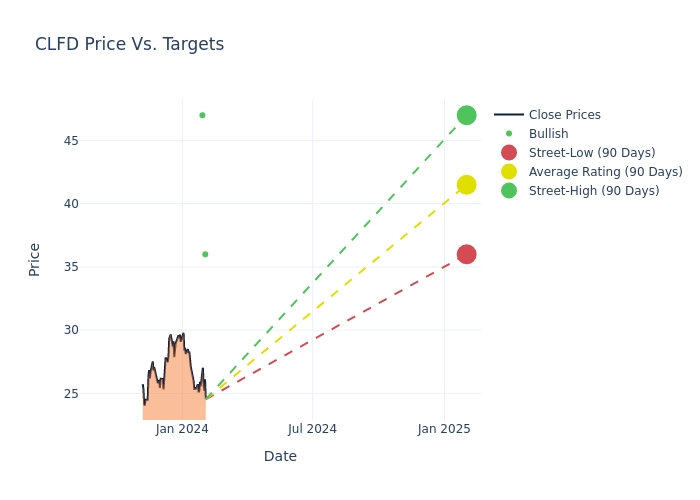
4 analysts have shared their evaluations of Clearfield CLFD during the recent three months, expressing a mix of bullish and bearish perspectives.
The table below summarizes their recent ratings, showcasing the evolving sentiments within the past 30 days and comparing them to the preceding months.
| Bullish | Somewhat Bullish | Indifferent | Somewhat Bearish | Bearish | |
|---|---|---|---|---|---|
| Total Ratings | 4 | 0 | 0 | 0 | 0 |
| Last 30D | 1 | 0 | 0 | 0 | 0 |
| 1M Ago | 2 | 0 | 0 | 0 | 0 |
| 2M Ago | 0 | 0 | 0 | 0 | 0 |
| 3M Ago | 1 | 0 | 0 | 0 | 0 |
Analysts have set 12-month price targets for Clearfield, revealing an average target of $40.75, a high estimate of $47.00, and a low estimate of $36.00. A negative shift in sentiment is evident as analysts have decreased the average price target by 8.78%.

Deciphering Analyst Ratings: An In-Depth Analysis
In examining recent analyst actions, we gain insights into how financial experts perceive Clearfield. The following summary outlines key analysts, their recent evaluations, and adjustments to ratings and price targets.
| Analyst | Analyst Firm | Action Taken | Rating | Current Price Target | Prior Price Target |
|---|---|---|---|---|---|
| Ryan Koontz | Needham | Lowers | Buy | $36.00 | $40.00 |
| Scott Searle | Roth MKM | Lowers | Buy | $47.00 | $49.00 |
| Ryan Koontz | Needham | Maintains | Buy | $40.00 | - |
| Ryan Koontz | Needham | Lowers | Buy | $40.00 | $45.00 |
Key Insights:
- Action Taken: Responding to changing market dynamics and company performance, analysts update their recommendations. Whether they 'Maintain', 'Raise', or 'Lower' their stance, it signifies their response to recent developments related to Clearfield. This offers insight into analysts' perspectives on the current state of the company.
- Rating: Analyzing trends, analysts offer qualitative evaluations, ranging from 'Outperform' to 'Underperform'. These ratings convey expectations for the relative performance of Clearfield compared to the broader market.
- Price Targets: Analysts gauge the dynamics of price targets, providing estimates for the future value of Clearfield's stock. This comparison reveals trends in analysts' expectations over time.
Analyzing these analyst evaluations alongside relevant financial metrics can provide a comprehensive view of Clearfield's market position. Stay informed and make data-driven decisions with the assistance of our Ratings Table.
Stay up to date on Clearfield analyst ratings.
If you are interested in following small-cap stock news and performance you can start by tracking it here.
All You Need to Know About Clearfield
Clearfield Inc mainly designs, manufactures, and distributes fiber protection, fiber management and fiber delivery solutions for communications networks. It provides a range of products including copper assemblies, cassettes, box enclosures, fiber connectors, frames, microduct, terminals, vaults, pedestal inserts, FieldSmart, WaveSmart, and CraftSmart. The company has a global presence with the majority of the revenue derived from the United States. The company has two reportable segments namely Clearfield segment and Nestor cables segment. The majority of revenue is derived from Clearfield segment.
A Deep Dive into Clearfield's Financials
Market Capitalization Analysis: Below industry benchmarks, the company's market capitalization reflects a smaller scale relative to peers. This could be attributed to factors such as growth expectations or operational capacity.
Revenue Challenges: Clearfield's revenue growth over 3 months faced difficulties. As of 30 September, 2023, the company experienced a decline of approximately -47.72%. This indicates a decrease in top-line earnings. In comparison to its industry peers, the company trails behind with a growth rate lower than the average among peers in the Information Technology sector.
Net Margin: Clearfield's net margin is impressive, surpassing industry averages. With a net margin of 5.43%, the company demonstrates strong profitability and effective cost management.
Return on Equity (ROE): Clearfield's ROE is below industry standards, pointing towards difficulties in efficiently utilizing equity capital. With an ROE of 0.86%, the company may encounter challenges in delivering satisfactory returns for shareholders.
Return on Assets (ROA): Clearfield's ROA stands out, surpassing industry averages. With an impressive ROA of 0.75%, the company demonstrates effective utilization of assets and strong financial performance.
Debt Management: Clearfield's debt-to-equity ratio is below the industry average. With a ratio of 0.07, the company relies less on debt financing, maintaining a healthier balance between debt and equity, which can be viewed positively by investors.
The Core of Analyst Ratings: What Every Investor Should Know
Ratings come from analysts, or specialists within banking and financial systems that report for specific stocks or defined sectors (typically once per quarter for each stock). Analysts usually derive their information from company conference calls and meetings, financial statements, and conversations with important insiders to reach their decisions.
Some analysts will also offer forecasts for metrics like growth estimates, earnings, and revenue to provide further guidance on stocks. Investors who use analyst ratings should note that this specialized advice comes from humans and may be subject to error.
This article was generated by Benzinga's automated content engine and reviewed by an editor.
Edge Rankings
Price Trend
© 2025 Benzinga.com. Benzinga does not provide investment advice. All rights reserved.
date | ticker | name | Price Target | Upside/Downside | Recommendation | Firm |
|---|
Trade confidently with insights and alerts from analyst ratings, free reports and breaking news that affects the stocks you care about.