Zinger Key Points
- The S&P 500 broke above 5000 again on Friday, while the S&P 500 traded just under $500.
- A pullback is likely to come over the next few days because the S&P 500 is trading in overbought territory.
- Today's manic market swings are creating the perfect setup for Matt’s next volatility trade. Get his next trade alert for free, right here.
The S&P 500 breached the 5000 mark Friday after flirting with the record-breaking level on Thursday, buoyed by increasing positive sentiment that the Federal Reserve will apply six rate cuts this year.
The Bureau of Labor Statistics said Friday the Consumer Price Index inflation adjustments for the final quarter of 2023 remained unchanged at 3.3%. Markets are now looking ahead to Feb. 13, when January’s CPI data is set to be released and analysts anticipate a notable slowdown in the yearly headline inflation rate, dropping from December's 3.4% to 3%.
The stock market has been defying gravity since Jan. 19, pointing to new all-time highs during almost every trading session. The move has been driven by the Magnificent Seven, with five of the mega-cap stocks soaring to new all-time highs over the last few months.
Trending: Russian President Tells Tucker Carlson Moscow Will Attack This NATO Member 'Only In One Case'
While for traders, the trend is your friend, both the S&P 500 and the SPDR S&P 500 SPY have reached overbought territory, which suggests at least a short-term pullback is likely on the horizon.
More experienced traders who wish to play the SPY either bullishly or bearishly may choose to do so through one of two Direxion ETFs. Bullish traders can enter a short-term position in Direxion Daily S&P 500 Bull 3X Shares SPXL and bearish traders can trade the inverse ETF, Direxion Daily S&P 500 Bear 3X Shares SPXS.
The ETFs: SPXL and SPXS are triple leveraged funds that track the movement of the SPY, seeking a return of 300% or –300% on the return of the benchmark index over a single day.
It should be noted that leveraged ETFs are meant to be used as a trading vehicle as opposed to long-term investments.
Want direct analysis? Find me in the BZ Pro lounge! Click here for a free trial.
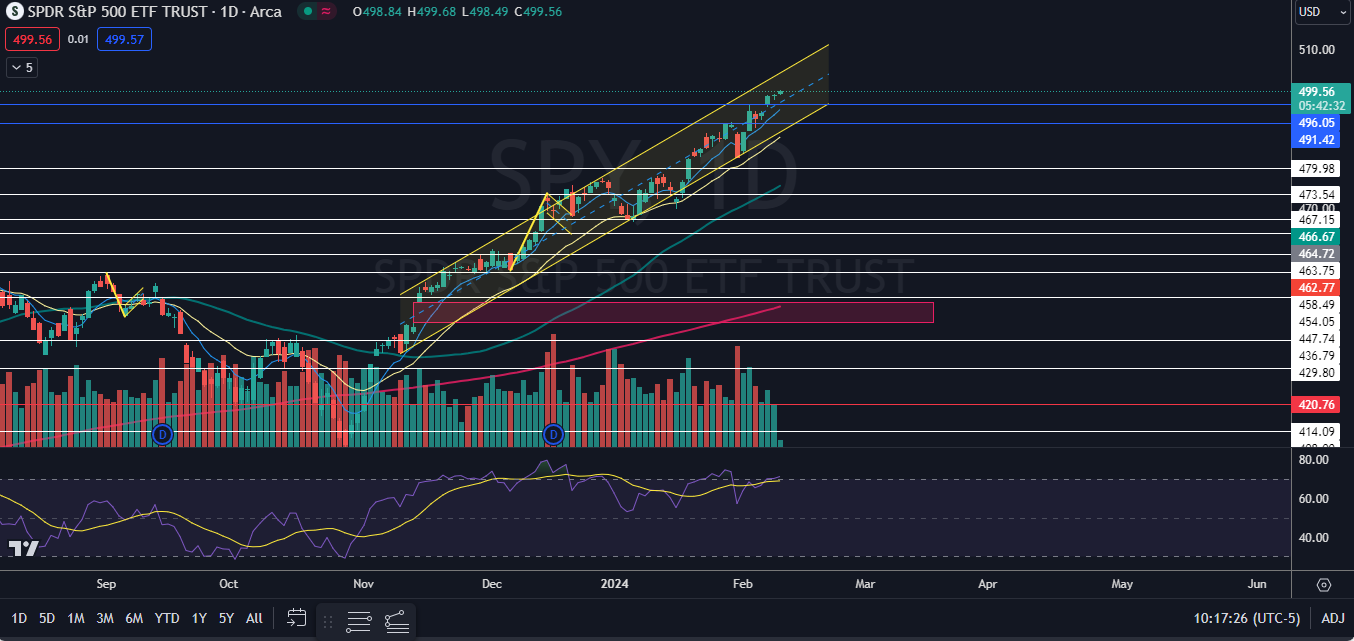
The SPY Chart: The SPY’s relative strength index (RSI) was trending near the 72% area on Friday, indicating the ETF has reached overbought territory. When a stock’s or ETF’s RSI surpasses the 70% mark, it can be a sell signal for short-term technical traders.
- The SPY has been trading in a steep uptrend since Oct. 27, making a fairly consistent series of higher high and higher lows on the daily chart. The most recent higher low was formed on Jan. 31 at $482.86 and the most recent confirmed higher high was printed at the $491.52 mark on Jan. 29.
- A higher low is likely to be created over the next few trading days because the SPY’s RSI is elevated and because volume has been decreasing, indicating the bulls are running out of steam. When the next retracement takes place, bullish traders want to see the ETF bounce up from the lower ascending trend line of the rising channel pattern, which the SPY has been trading in since Nov. 9.
- Bearish traders want to see big bearish volume come in and knock the SPY down under the bottom trend line of the rising channel, which could accelerate downside pressure and suggest a longer-term retracement is on the horizon. If that happens, the SPY is likely to find at least temporary support at the 50-day simple moving average.
- The SPY has resistance above at the psychologically important $500 area and at $505. The ETF has support below at $496.05 and at $491.42.

Edge Rankings
Price Trend
© 2025 Benzinga.com. Benzinga does not provide investment advice. All rights reserved.
Trade confidently with insights and alerts from analyst ratings, free reports and breaking news that affects the stocks you care about.