Zinger Key Points
- Analysts expect the company to report EPS of negative $1.32 on revenues of $1.262 billion.
- Rivian was working to print an inverted hammer candlestick on Wednesday but rejecting the 21-day EMA.
- Feel unsure about the market’s next move? Copy trade alerts from Matt Maley—a Wall Street veteran who consistently finds profits in volatile markets. Claim your 7-day free trial now.
Rivian Automotive, Inc RIVN was trading about 3% lower Wednesday as the company heads into its first-quarter earnings print after the market close.
Analysts expect the company to report EPS of negative $1.32 on revenues of $1.262 billion for the quarter ending Dec. 31.
Last week, Barclays analyst Dan Levy downgraded Rivian from Overweight to Equal-Weight and lowered a price target from $25 to $16. Read More Here...
When Rivian printed its third-quarter earnings report on Nov. 7, the stock was highly volatile the following day, gapping up about 8.5% before falling to close about 2.41% lower.
For that quarter, Rivian reported earnings per share of negative $1.19, beating a Street estimate of a loss of $1.32 per share. The company also posted a top-line beat, reporting revenues of $1.337 billion, compared to the $1.327-billion consensus estimate.
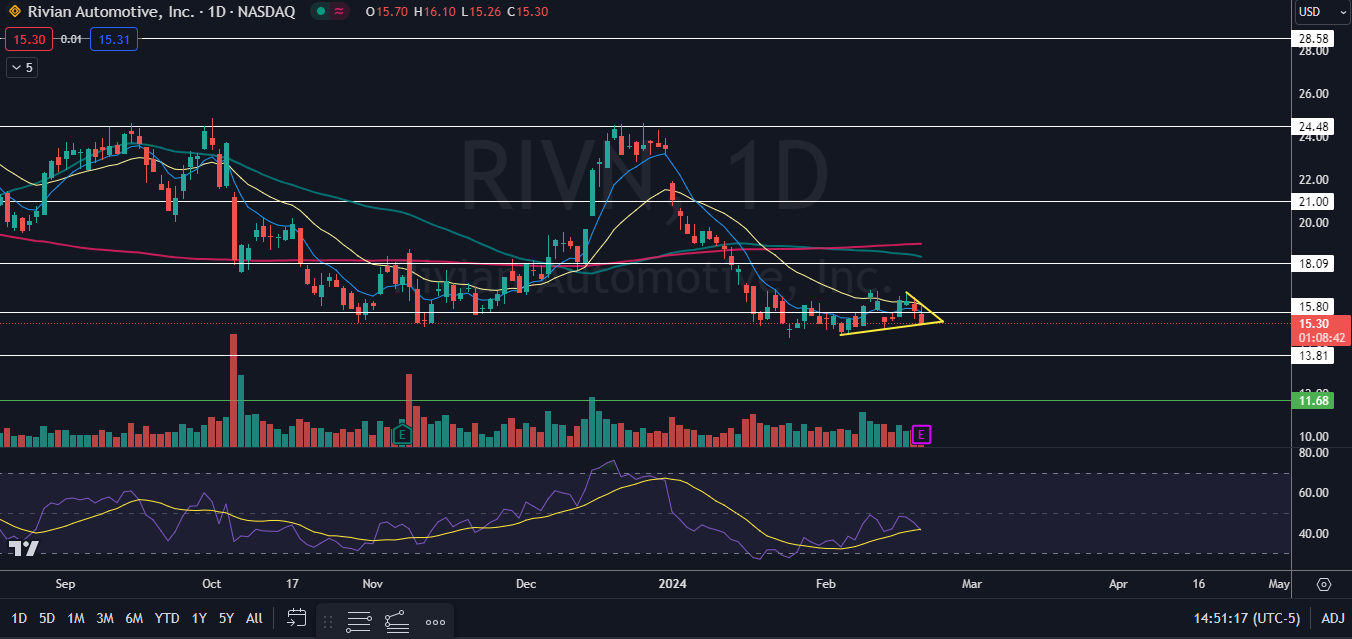
From a technical perspective, Rivian looks neutral heading into the event, forming an inverted hammer candlestick but rejecting the eight-day exponential moving average (EMA). Of course, holding a position in a stock over earnings can be akin to gambling, as stocks can rise following an earnings miss and fall after reporting a beat.
Read Next: Rivian CEO RJ Scaringe Zeroes In On $48K As 'Sweet Spot' For R2 Pricing
Bullish On Rivian? Traders and Investors looking to play the possible upside in Rivian stock but with diversification may choose to take a position in the Spear Alpha ETF SPRX. SPRX is an actively managed fund offering investors the opportunity to achieve more than passive tracking of the broader market. Some of the fund's most popular holdings include NVIDIA Corporation, weighted at 10.48%, Advanced Micro Devices, Inc AMD weighted at 9.04% and Snowflake, Inc SNOW, weighted at 8.87%.
SPRX invests in companies capitalizing on emerging trends in industrial technology, aiming to uncover undervalued opportunities within various value chains aligned with themes such as enterprise digitalization, automation, AI, environmental focus, photonics, additive manufacturing, and space exploration. The ETF, traded on the Nasdaq exchange, targets long-term capital growth and is up about 64% over the last twelve months and about 4.2% year-to-date.
Want direct analysis? Find me in the BZ Pro lounge! Click here for a free trial.
The Rivian Chart: Rivian has been trading mostly sideways since Jan. 17, but since Feb. 5, the stock has made a series of higher lows on the daily chart. On Wednesday, Rivian was working to form an inverted hammer candlestick, which could signal the local bottom has occurred and the stock may bounce on Thursday.
- Rivian’s relative strength index (RSI) has been making a series of higher highs and higher lows, indicating positive momentum in the stock is increasing.
- Bullish traders want to see Rivian receive a bullish reaction to its earnings print and for the stock to form a higher high above the Feb. 16 high of $16.73, which would throw the stock into a confirmed uptrend. Bearish traders want to see Rivian continue to reject the 21-day EMA and for the stock to drop under the $15.27 mark on Thursday, which would confirm a new downtrend.
- Rivian has resistance above at $15.80 and at $18.09 and support below at $13.81 and at $11.68.

Edge Rankings
Price Trend
© 2025 Benzinga.com. Benzinga does not provide investment advice. All rights reserved.
Trade confidently with insights and alerts from analyst ratings, free reports and breaking news that affects the stocks you care about.