In the ever-evolving and intensely competitive business landscape, conducting a thorough company analysis is of utmost importance for investors and industry followers. In this article, we will carry out an in-depth industry comparison, assessing Accenture ACN alongside its primary competitors in the IT Services industry. By meticulously examining key financial metrics, market positioning, and growth prospects, we aim to offer valuable insights to investors and shed light on company's performance within the industry.
Accenture Background
Accenture is a leading global IT-services firm that provides consulting, strategy, and technology and operational services. These services run the gamut from aiding enterprises with digital transformation to procurement services to software system integration. The company provides its IT offerings to a variety of sectors, including communications, media and technology, financial services, health and public services, consumer products, and resources. Accenture employs just under 500,000 people throughout 200 cities in 51 countries.
| Company | P/E | P/B | P/S | ROE | EBITDA (in billions) | Gross Profit (in billions) | Revenue Growth |
|---|---|---|---|---|---|---|---|
| Accenture PLC | 30.50 | 7.80 | 3.32 | 6.23% | $2.45 | $4.88 | -0.09% |
| International Business Machines Corp | 23.13 | 7.67 | 2.81 | 14.42% | $5.32 | $10.27 | 4.13% |
| Infosys Ltd | 25 | 7.64 | 3.97 | 7.58% | $0.96 | $1.39 | 0.09% |
| Gartner Inc | 42.91 | 54.46 | 6.41 | 33.45% | $0.39 | $1.06 | 5.41% |
| Cognizant Technology Solutions Corp | 17.20 | 2.73 | 1.89 | 4.27% | $0.9 | $1.68 | -1.67% |
| Wipro Ltd | 22.08 | 3.53 | 2.80 | 3.87% | $38.12 | $65.97 | -0.11% |
| EPAM Systems Inc | 38.02 | 4.47 | 3.38 | 2.88% | $0.16 | $0.36 | -6.01% |
| Globant SA | 54.67 | 4.96 | 4.14 | 2.42% | $0.05 | $0.21 | 18.34% |
| Endava PLC | 25.83 | 2.79 | 2.28 | 1.37% | $0.0 | $0.04 | -10.57% |
| Perficient Inc | 19.31 | 3.51 | 2.16 | 4.49% | $0.04 | $0.1 | -5.08% |
| The Hackett Group Inc | 19.35 | 7.32 | 2.23 | 9.19% | $0.01 | $0.03 | 3.26% |
| CI&T Inc | 17.93 | 2.01 | 1.28 | 2.56% | $0.09 | $0.17 | -5.35% |
| Information Services Group Inc | 33.42 | 1.90 | 0.69 | -2.76% | $-0.0 | $0.03 | -10.76% |
| CSP Inc | 44.65 | 4.03 | 2.80 | -0.16% | $0.0 | $0.0 | -16.19% |
| Average | 29.5 | 8.23 | 2.83 | 6.43% | $3.54 | $6.25 | -1.89% |
By closely examining Accenture, we can identify the following trends:
-
The Price to Earnings ratio of 30.5 for this company is 1.03x above the industry average, indicating a premium valuation associated with the stock.
-
With a Price to Book ratio of 7.8, significantly falling below the industry average by 0.95x, it suggests undervaluation and the possibility of untapped growth prospects.
-
With a relatively high Price to Sales ratio of 3.32, which is 1.17x the industry average, the stock might be considered overvalued based on sales performance.
-
The Return on Equity (ROE) of 6.23% is 0.2% below the industry average, suggesting potential inefficiency in utilizing equity to generate profits.
-
With lower Earnings Before Interest, Taxes, Depreciation, and Amortization (EBITDA) of $2.45 Billion, which is 0.69x below the industry average, the company may face lower profitability or financial challenges.
-
The gross profit of $4.88 Billion is 0.78x below that of its industry, suggesting potential lower revenue after accounting for production costs.
-
The company's revenue growth of -0.09% is notably higher compared to the industry average of -1.89%, showcasing exceptional sales performance and strong demand for its products or services.
Debt To Equity Ratio

The debt-to-equity (D/E) ratio measures the financial leverage of a company by evaluating its debt relative to its equity.
Considering the debt-to-equity ratio in industry comparisons allows for a concise evaluation of a company's financial health and risk profile, aiding in informed decision-making.
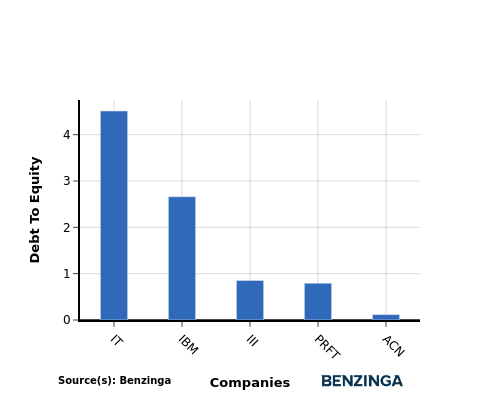
By considering the Debt-to-Equity ratio, Accenture can be compared to its top 4 peers, leading to the following observations:
-
Among its top 4 peers, Accenture has a stronger financial position with a lower debt-to-equity ratio of 0.12.
-
This indicates that the company relies less on debt financing and maintains a more favorable balance between debt and equity, which can be viewed positively by investors.
Key Takeaways
For Accenture in the IT Services industry, the PE ratio is high compared to peers, indicating potential overvaluation. The PB ratio is low, suggesting a possible undervaluation based on its book value. The PS ratio is high, signaling a premium valuation relative to sales. In terms of ROE, EBITDA, gross profit, and revenue growth, Accenture lags behind its industry peers, indicating lower profitability and growth potential.
This article was generated by Benzinga's automated content engine and reviewed by an editor.
© 2025 Benzinga.com. Benzinga does not provide investment advice. All rights reserved.
Trade confidently with insights and alerts from analyst ratings, free reports and breaking news that affects the stocks you care about.