Zinger Key Points
- Chinese stocks are at their highest since Sept 2023, up 19% from 2024 lows, as signs of economic recovery spark robust investor optimism.
- Despite market gains, 77% of Chinese A-shares see earnings downgrades, raising concerns about premature recovery bets.
- Our government trade tracker caught Pelosi’s 169% AI winner. Discover how to track all 535 Congress member stock trades today.
Once haunted by a domestic real estate collapse reminiscent of a Lehman-like crisis, Chinese stocks witnessed a significant rally in the first part of the year, reviving investor bets on the beginning of a more serious and robust recovery.
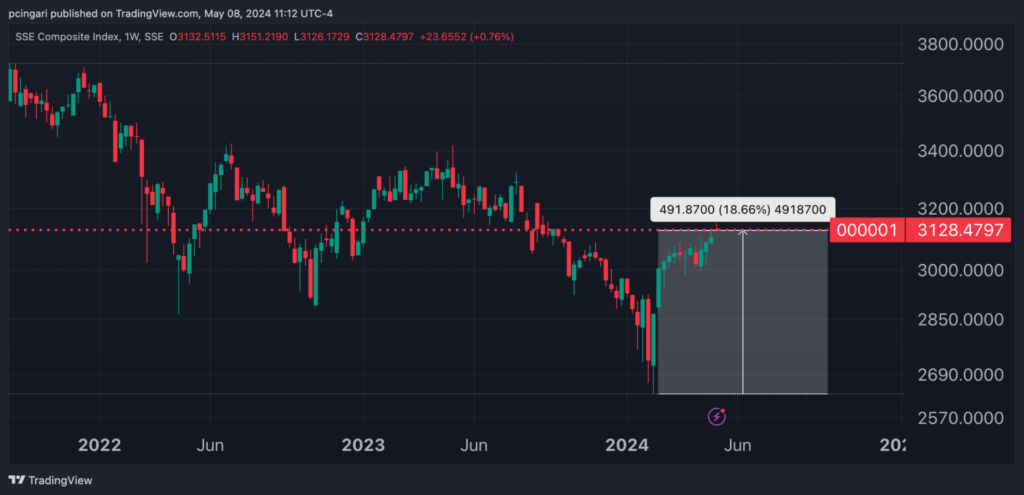
On Tuesday (May 7), the SSE Composite Index, which includes all stocks listed on the Shanghai Stock Exchange, reached its highest level since September 2023, showcasing a rally of about 19% from the lows in 2024.
The revival in Chinese stocks can be attributed to a confluence of factors. Key among these is the country’s economic recovery, which has gathered pace after years of turbulence following the bursting of a real estate bubble.
China's economy expanded by 5.3% in the first quarter year-over-year. This growth rate not only outpaced the previous quarter’s 5.2% but also exceeded the 5% growth expected by analysts.
Surveys on private sector economic activity showed signs of strength in April 2024, with the Caixin Services PMI marking the highest level since May 2023 and the manufacturing PMI also notching expansionary conditions.
Additionally, technical factors such as the massive exit of foreign investors, which put an end to fear-driven selling, have played a crucial role.
Chart: Chinese Stocks Have Rebounded 19% Off 2024 Lows – More To Come?

Are Investors Overestimating China’s Market Recovery? Stock Surge vs. Earnings Reality
There is a risk investors are moving too early in betting on a Chinese recovery as the earnings season thus far as mostly disappointed expectations.
As Bank of America’s strategist Willie Chan reported recently, 77% of Chinese A-shares stocks revised down 2024 earnings, with all sectors witnessing net downward revisions.
“We believe a fundamental turnaround in economy and earnings would take time,” Chan stated.
“The MSCI China lowered 2024E earnings growth from 15.8% YoY in Jan-24 to 12.1% YoY in Apr-24. We are concerned the market will need to further revise down 2024 earnings,” he added.
The expert noted that while recent macroeconomic data indicated emerging signs of improvement, the first quarter results were still a reflection of the difficult operating environment.
A Look at ETFs Tracking China’s Economic Rebound
Several (non-levered) exchange-traded funds are available for U.S.-based investors in get exposure to China’s ongoing economic rebound, each with its unique portfolio and strategy. Here's how they stand:
KraneShares CSI China Internet ETF KWEB
- AUM: $6.00 Billion
- Number of Holdings: 34
- Top Holdings: Tencent Holdings ADR TCEHY; Alibaba Group Holding Ltd. BABA; PDD Holdings Inc. – ADR PDD
- Benchmark: CSI Overseas China Internet Index
- Net Expenses: 0.70%
- Year-to-date Return: 9.52%
- Distance From All-Time High: 220%
iShares MSCI China ETF MCHI
- AUM: $5.24 Billion
- Number of Holdings: 671
- Top Holdings: Tencent; Alibaba; PDD
- Benchmark: MSCI China Index
- Net Expenses: 0.58%
- Year-to-date Return: 7.85%
- Distance From All-Time High: 108%
iShares China Large-Cap ETF FXI
- AUM: $4.84 Billion
- Number of Holdings: 58
- Top Holdings: Tencent; Meituan ADR MPNGY, Alibaba
- Benchmark: FTSE China 50 Index
- Net Expenses: 0.74%
- Year-to-date Return: 11.53%
- Distance From All-Time High: 90%
SPDR S&P China ETF GXC
- AUM: $482.09 Million
- Number of Holdings: 1,182
- Top Holdings: Tencent; Alibaba; PDD
- Benchmark: S&P China BMI Index
- Net Expenses: 0.59%
- Year-to-date Return: 5.49%
- Distance From All-Time High: 101%
iShares MSCI China A ETF CNYA
- AUM: $294.50 Million
- Number of Holdings: 526
- Top Holdings: Kweichow Moutai Co., Ltd.; Contemporary Amperex Technology Co., Ltd.
- Benchmark: MSCI China A Inclusion Index
- Net Expenses: 0.60%
- Year-to-date Return: 4.15%
- Distance From All-Time High: 70%
Invesco Golden Dragon China ETF PGJ
- AUM: $158.22 Million
- Number of Holdings: 61
- Top Holdings: Trip.com Group Ltd. TCOM, Baidu Inc. BIDU
- Benchmark: NASDAQ Golden Dragon China Index
- Net Expenses: 0.70%
- Year-to-date Return: 0.69%
- Distance From All-Time High: 216%
Franklin FTSE China ETF FLCH
- AUM: $111.49 Million
- Number of Holdings: 962
- Top Holdings: Tencent; Alibaba; PDD
- Benchmark: FTSE China Capped Index
- Net Expenses: 0.19%
- Year-to-date Return: 7.66%
- Distance From All-Time High: 106%
Read Now: Biden Administration Tightens Grip On China’s Huawei, Revokes Key Export Licenses From US Chipmakers
Photo: Shutterstock
© 2025 Benzinga.com. Benzinga does not provide investment advice. All rights reserved.
Trade confidently with insights and alerts from analyst ratings, free reports and breaking news that affects the stocks you care about.