


What to expect for July 1 - July 5, 2024
Originally published at volumeleaders.substack.com.
Weekly Wrap
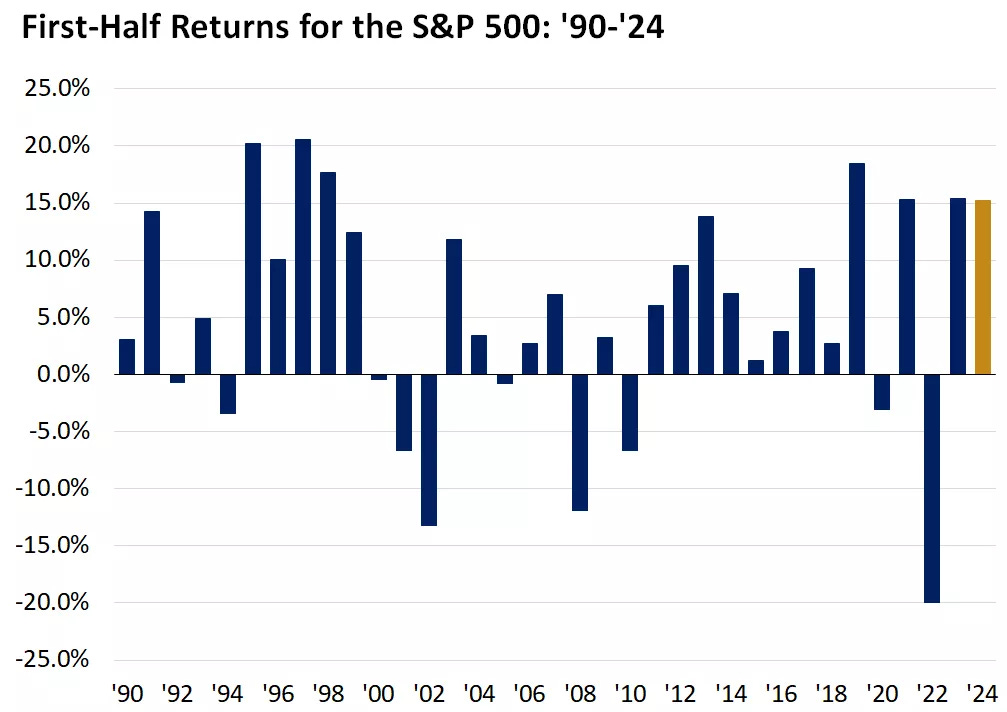
During the week of June 24-28, 2024, the U.S. stock market experienced mixed performance amidst fluctuating economic indicators with week highs eventually giving some back to yield-related losses. Favorable inflation revisions initially boosted investor sentiment, but stocks and bond yields reversed course. Overall, the first half of the year closed out strong - up 4% on the quarter and about 14% YTD - and historically this suggests continued strength into the back half of the year.
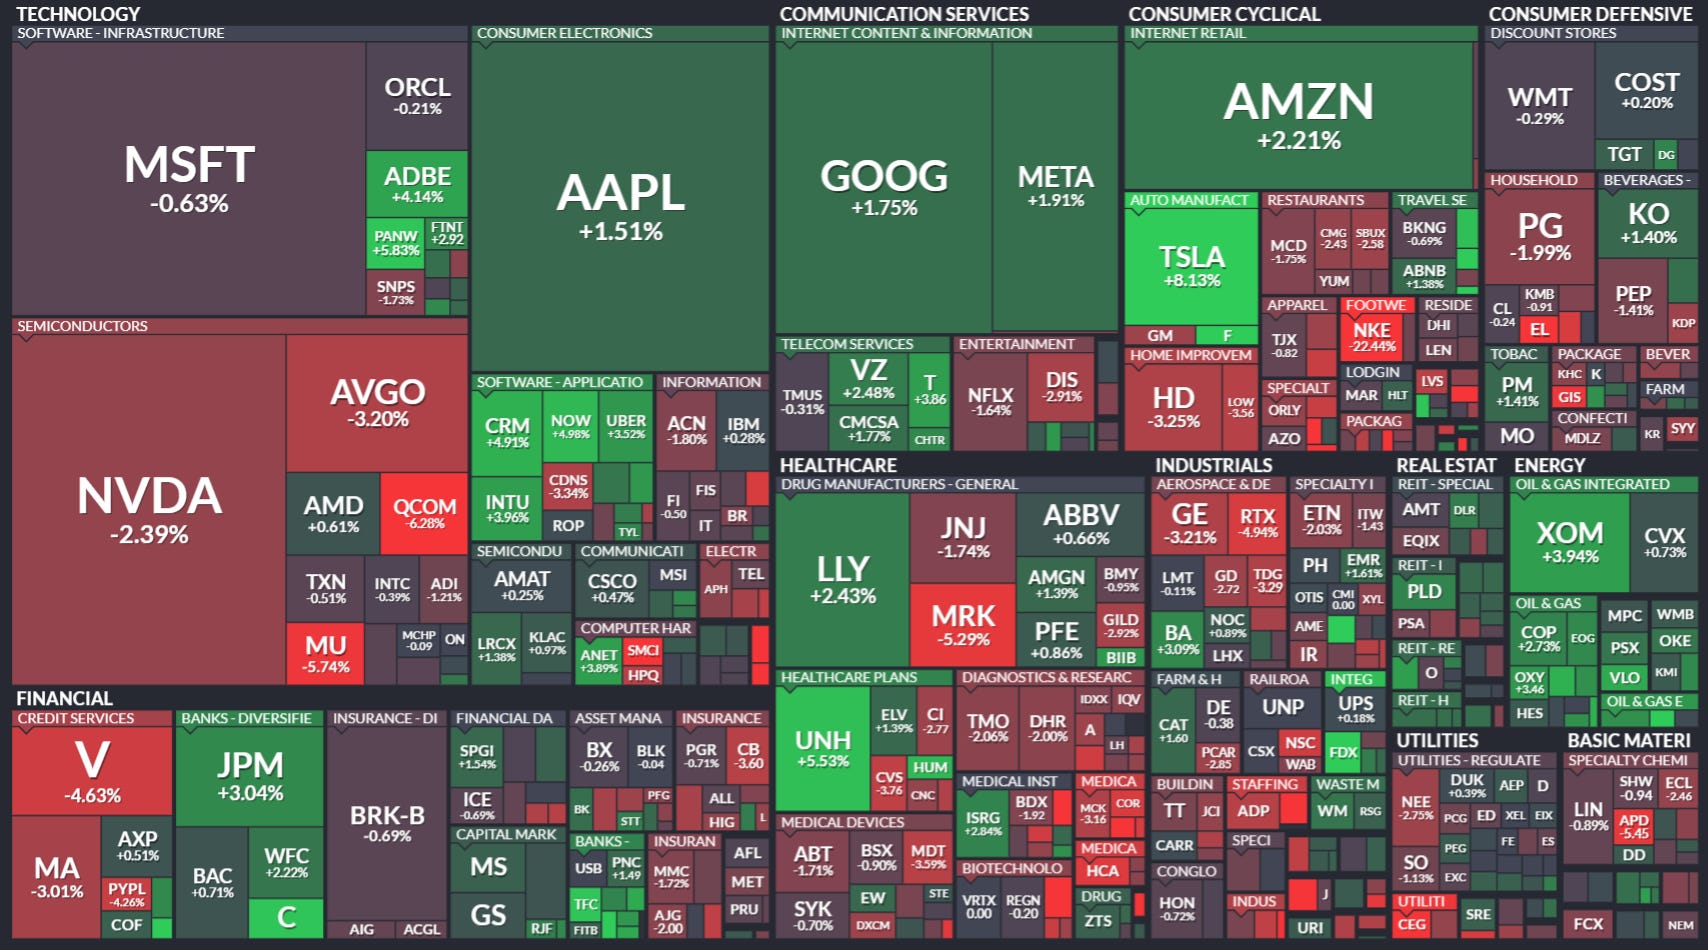
Inflation showed signs of cooling, which led to revised expectations for future interest rate hikes. Consumer sentiment improved slightly, reflecting optimism in economic recovery. Technology stocks, especially those in the AI sector, continued their upward trajectory, benefiting from strong earnings reports and positive outlooks. The energy sector saw gains due to rising oil prices driven by supply constraints and geopolitical tensions. Healthcare stocks were mixed, with some companies benefiting from new drug approvals while others faced regulatory challenges. Banks and financial institutions experienced volatility, influenced by fluctuating interest rates and mixed earnings reports. The value of Japan’s currency relative to the U.S. dollar fell on Friday to its lowest level since 1986.
Federal Reserve commentary hinted at a cautious approach to future rate hikes, balancing the need to control inflation without stifling economic growth. Escalating geopolitical tensions in Eastern Europe contributed to market volatility, particularly affecting energy and defense stocks.
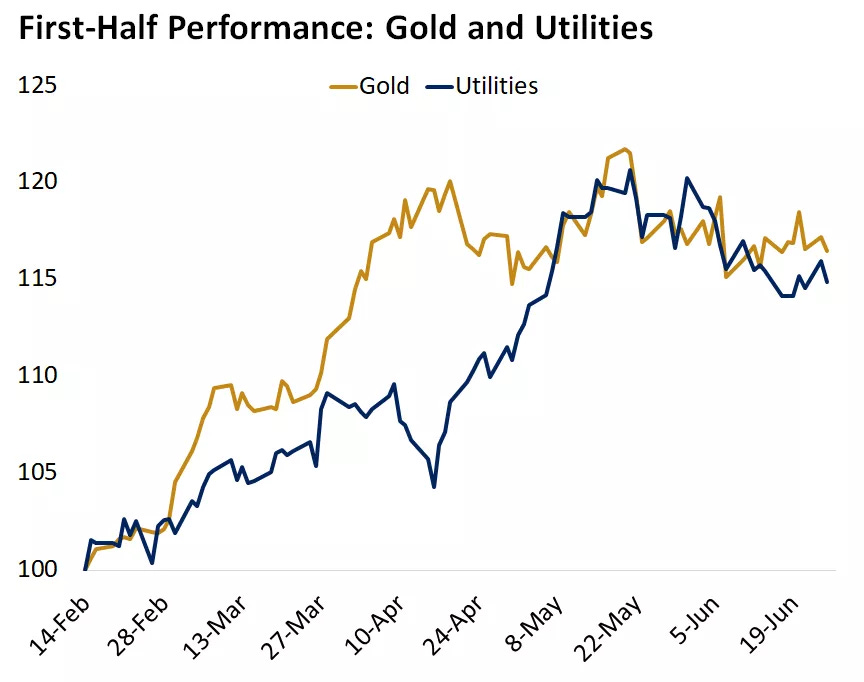
Overall, the market demonstrated resilience amidst mixed economic signals, with investors navigating inflation concerns, interest rate speculations, and geopolitical uncertainties. Defensive sectors like utilities and gold continue to provide safe-havens for those more risk-averse right now.
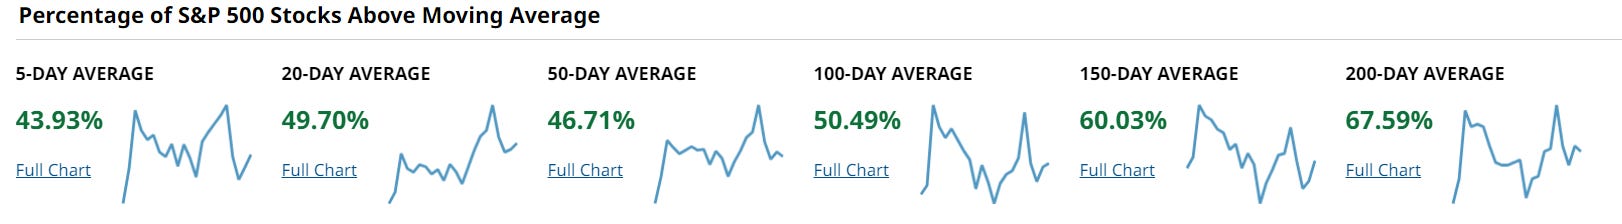
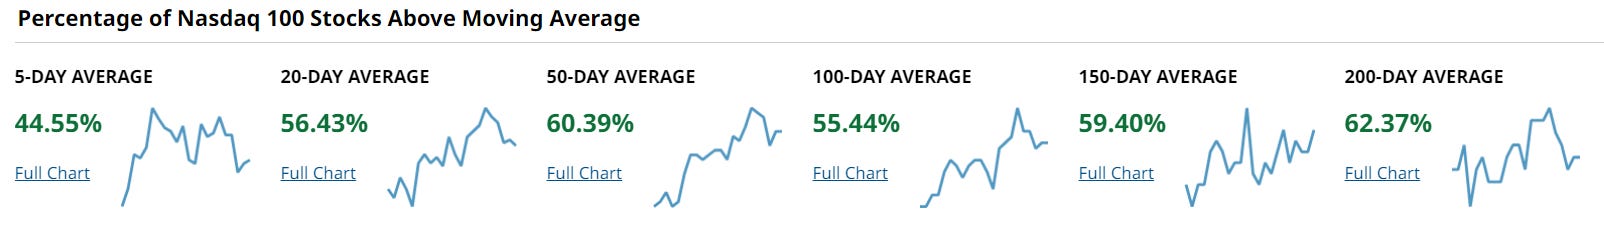
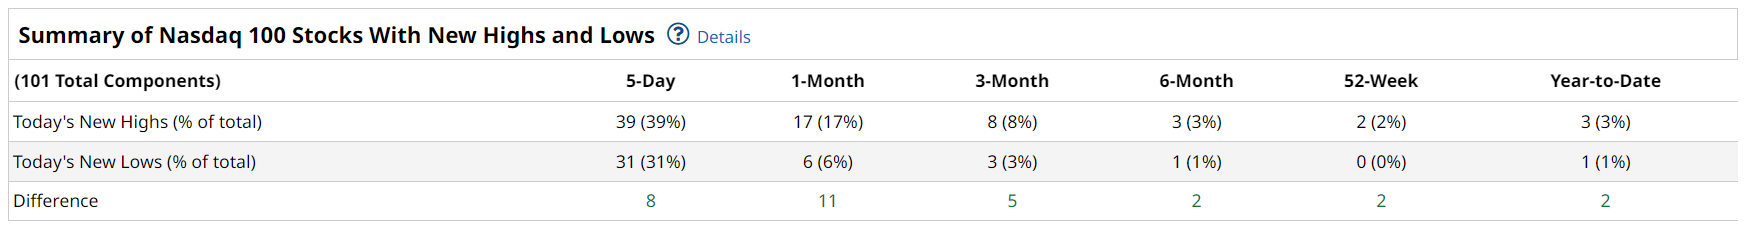
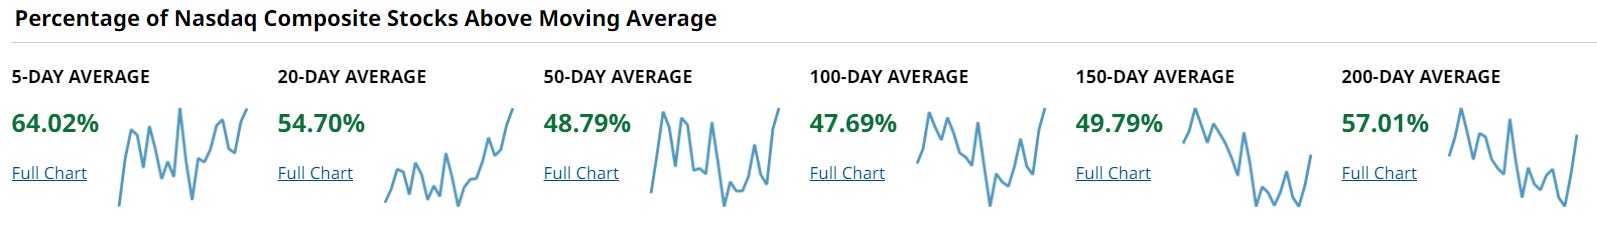
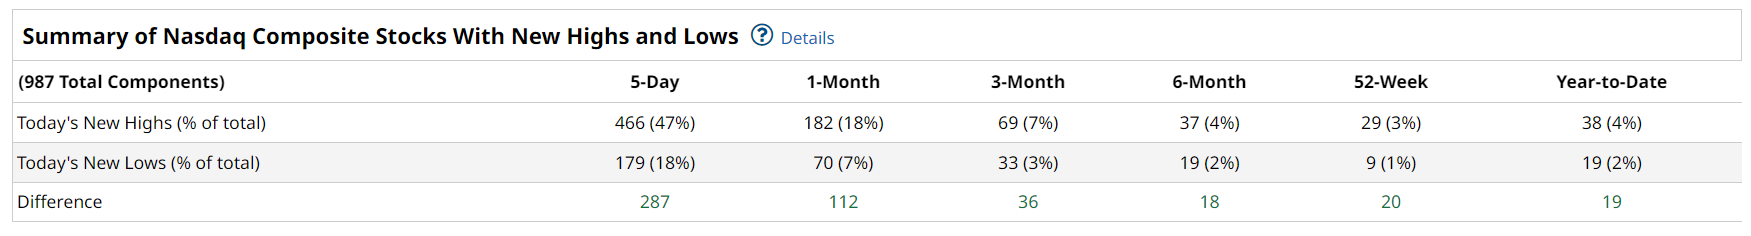
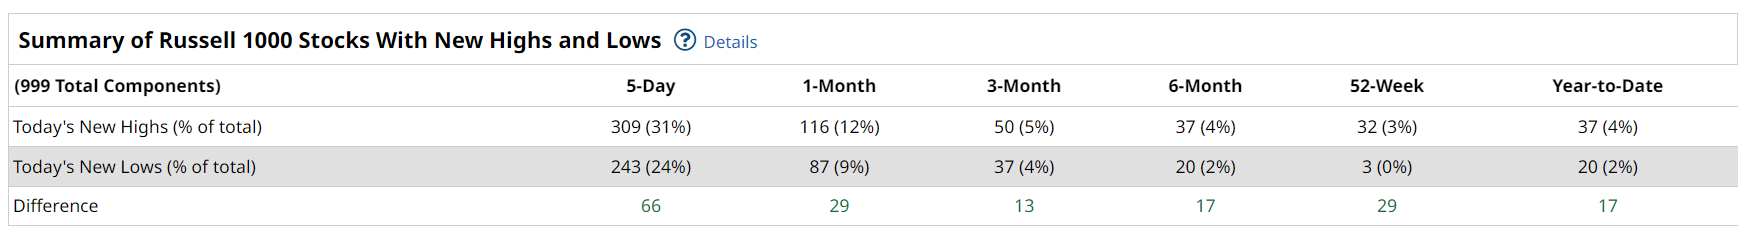
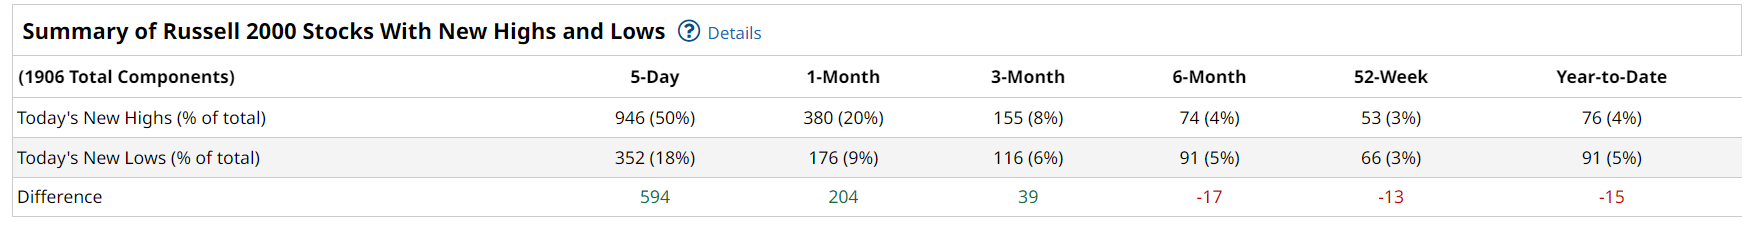
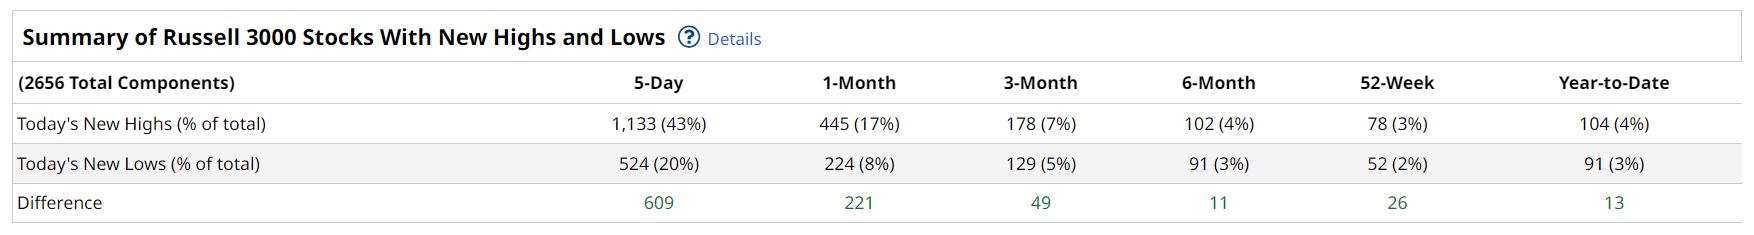
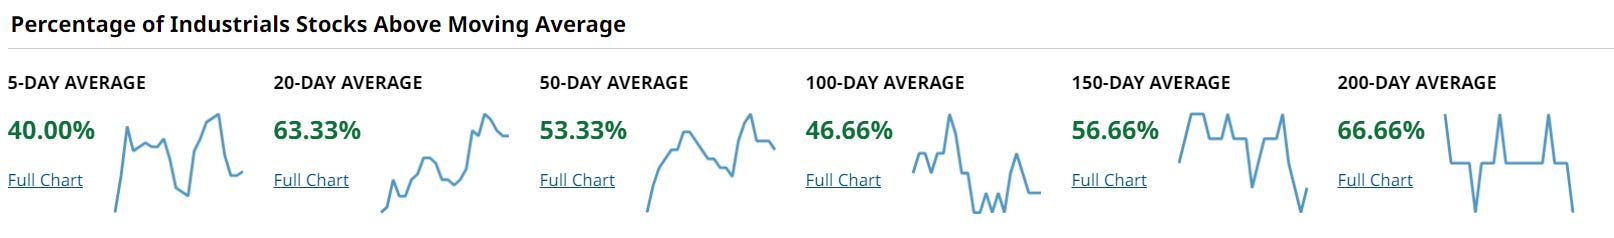
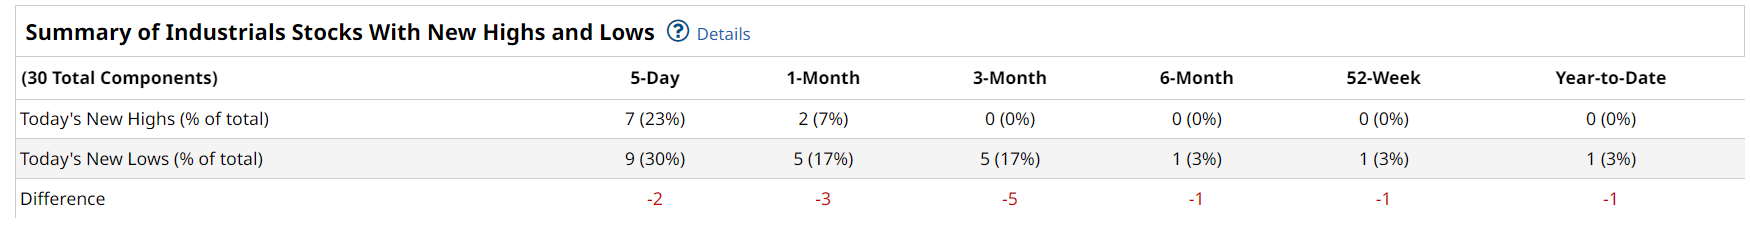
The week ended with indices giving a bunch back on Friday and stocks closed mixed on the week but with breadth showing some signs of improving and possibly solidifying first half gains. Independence Day is coming up so we’ll have another shortened trading week with what I expect to be lower-than-average volume. Keep it light and tight this week and in the absence of something exogenous, don’t read too much into movement.
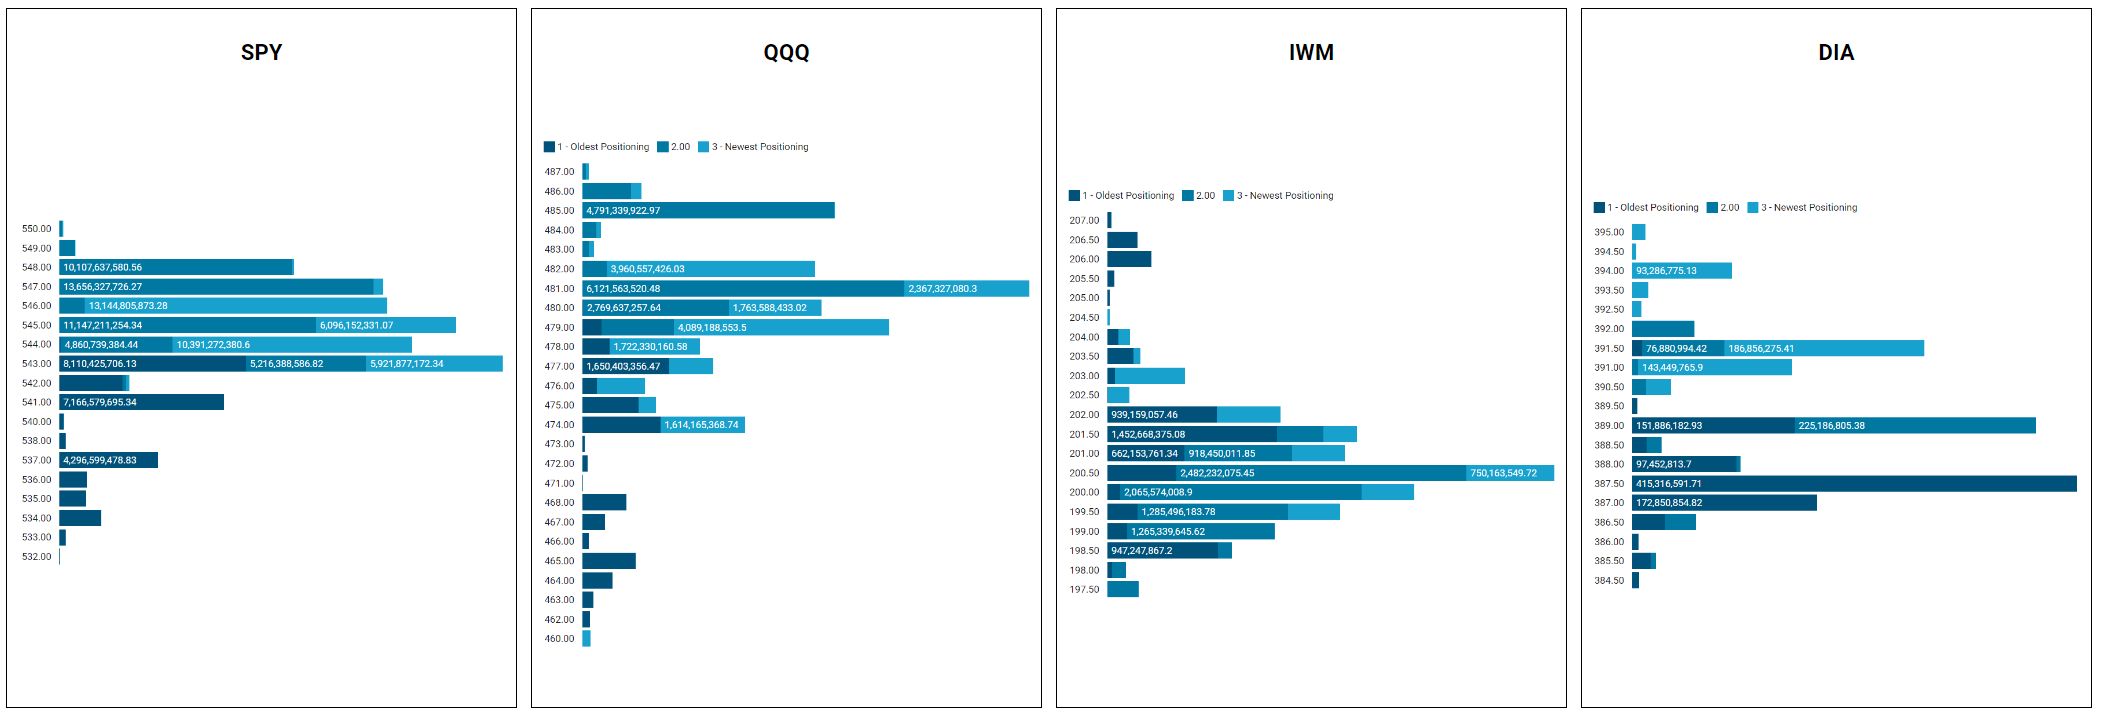
Institutional Dollar Index for Major Indices
Major Indices Chart Breakdowns
SPDR S&P 500 SPY
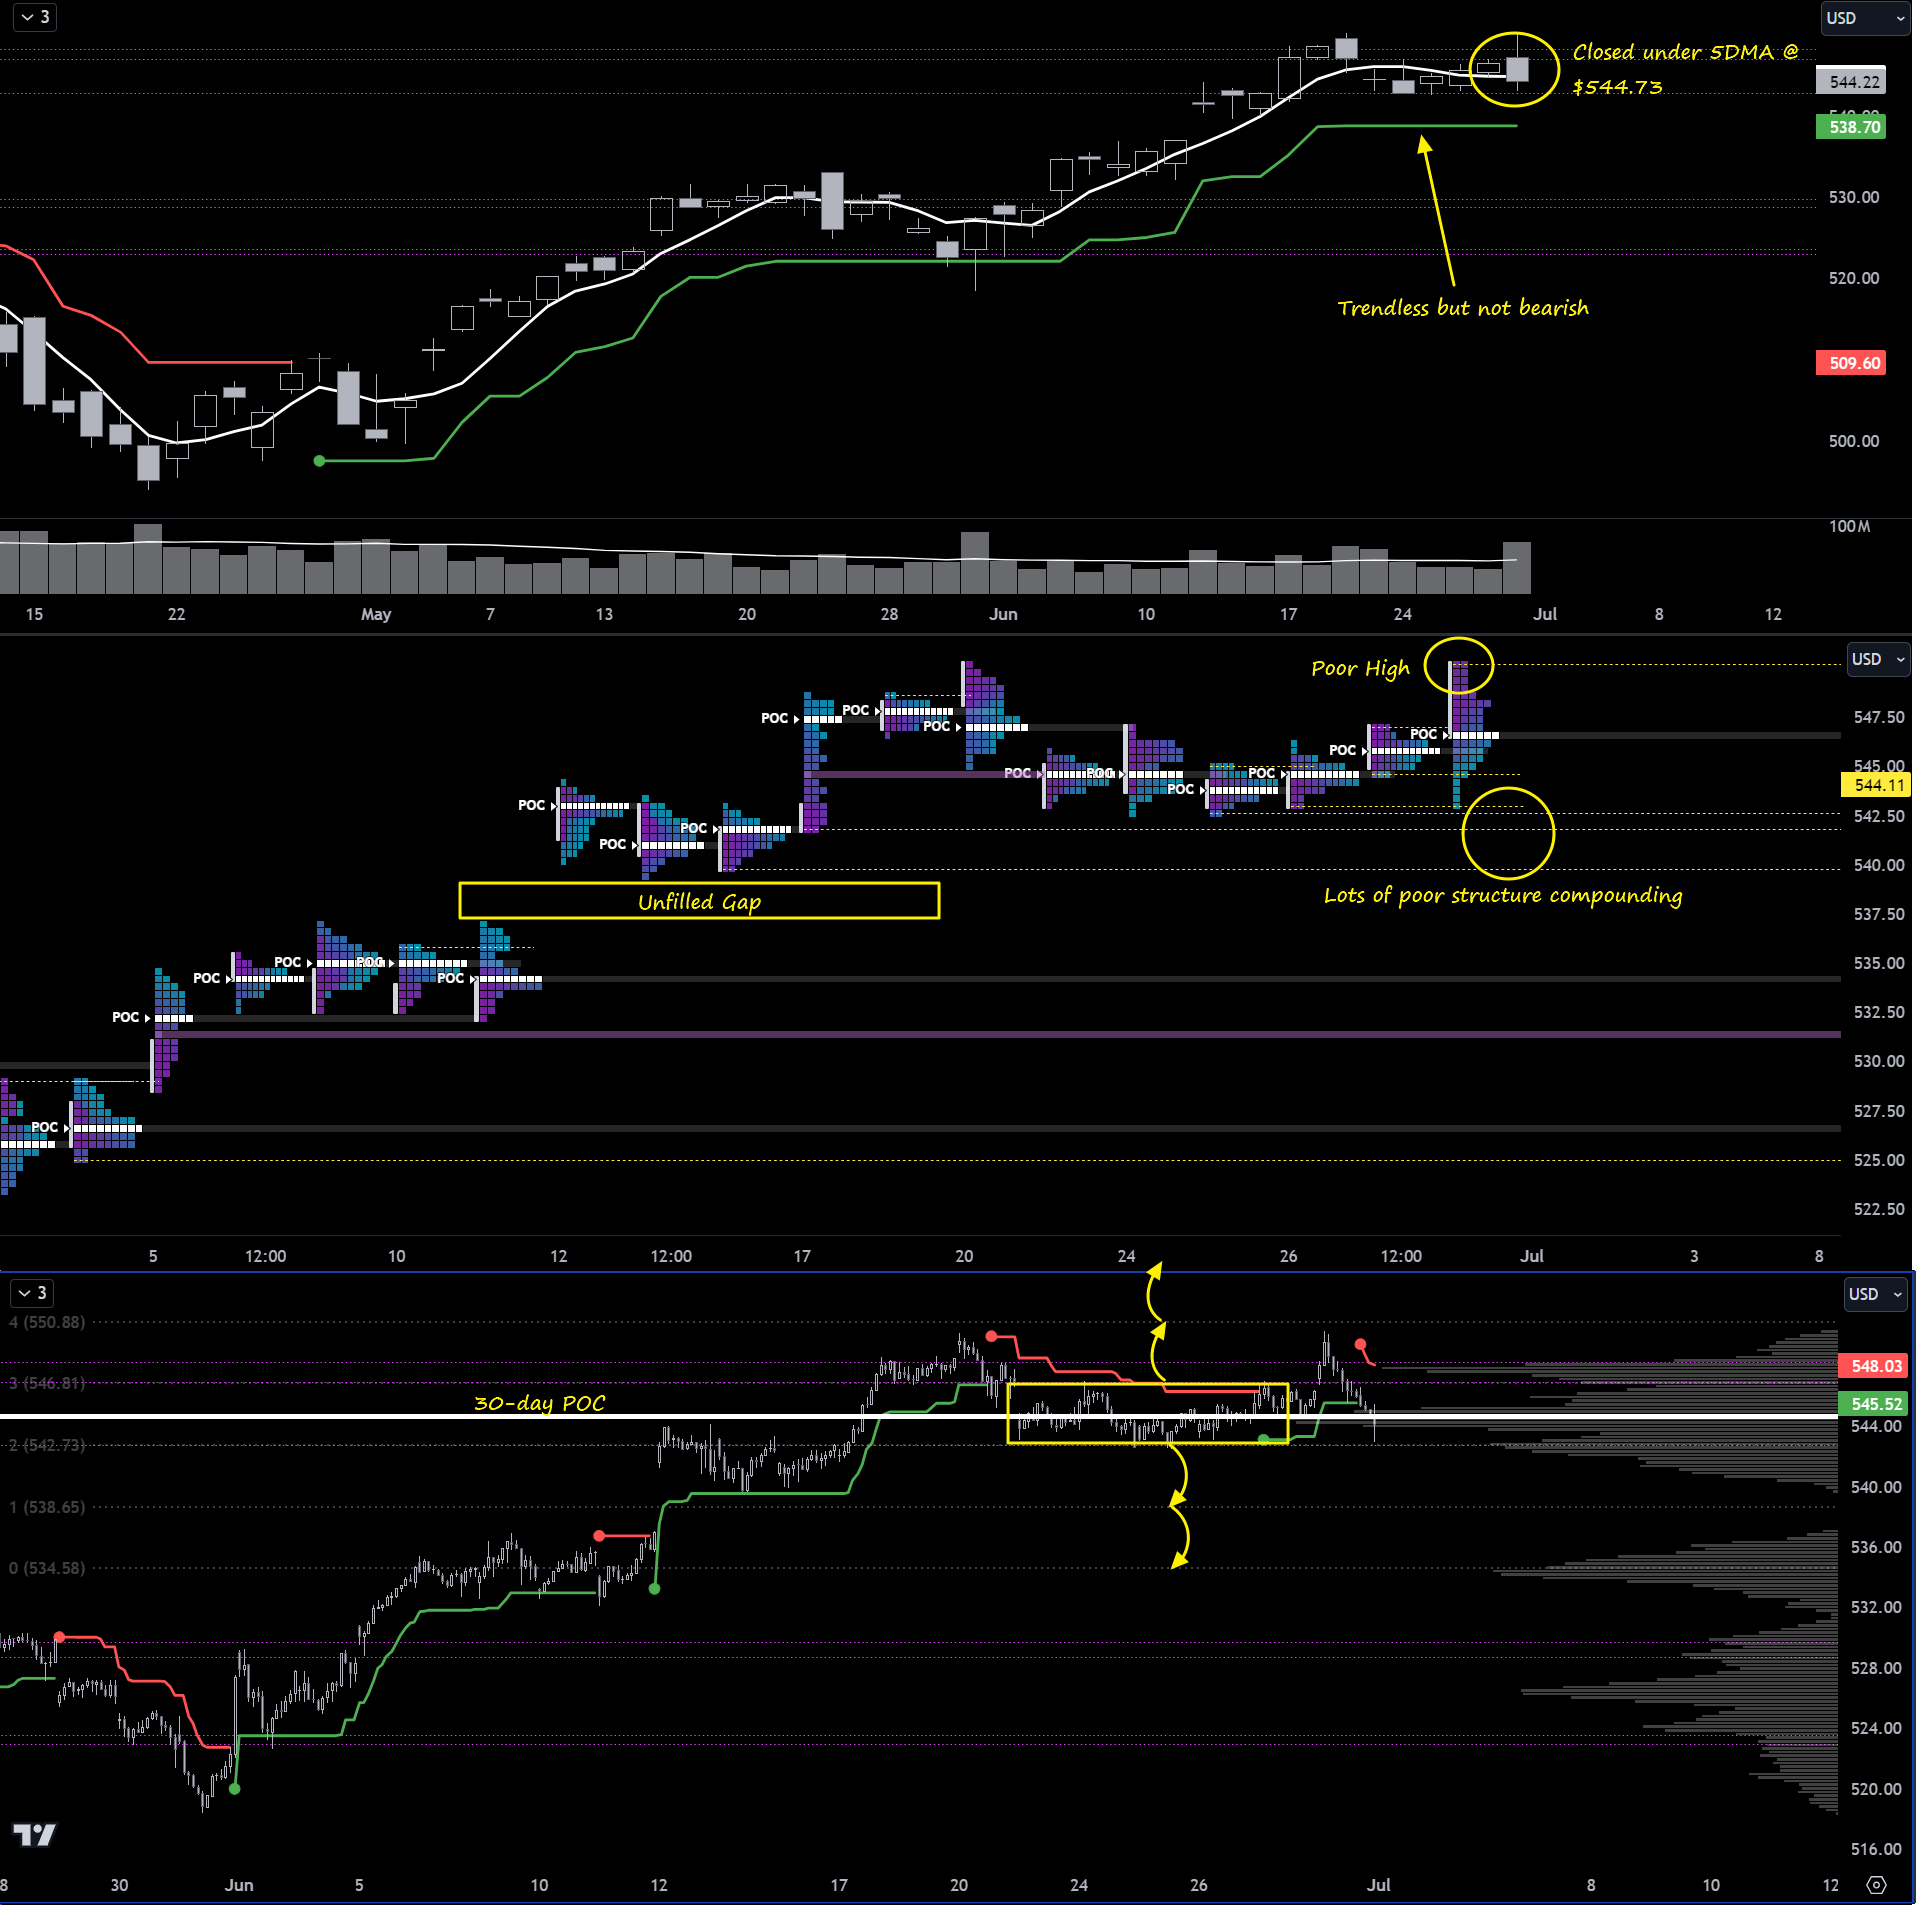
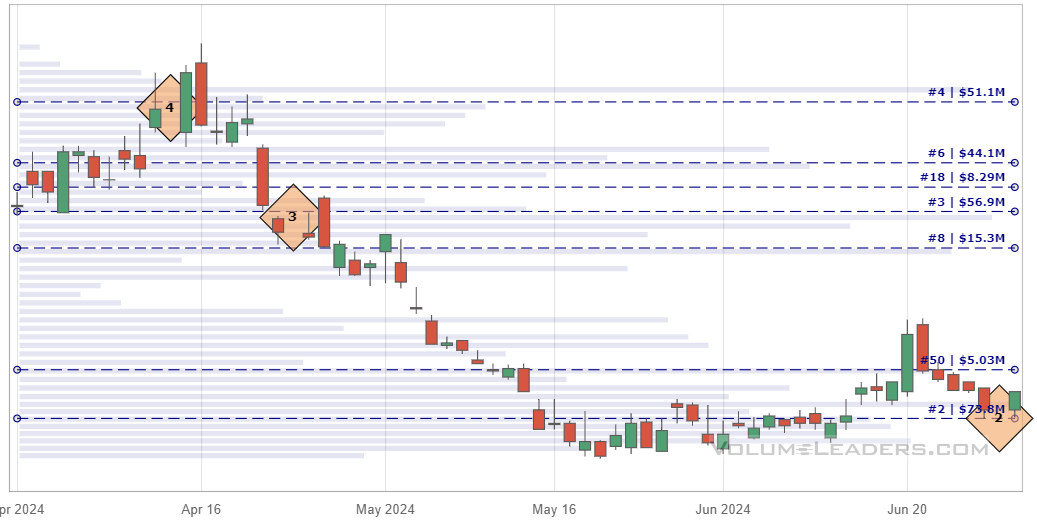
Top Pane/Daily: At this point, not putting a lot of weight on the daily close under the 5DMA at $544.73 because we’re broadly sideways for the past 9 sessions. This is further exemplified by the green Supertrend indicator painting a horizontal line ($538.70). Pay close attention to the purple levels the VL platform tracks for us…these represent the prices with the highest institutional involvement and should be marked-up on your execution charts for anything you’re trading. They are available for every ticker in VL and are always huge price magnets. I can only freely share the top 7 magnets for the past 30 days…if you want a more comprehensive picture, please go straight the “Charts” section in the VL platform. This feature alone is worth more than what I charge for a subscription; it is just an absolute money printer. The last thing I want to point out is the large print in VIXM 0.00%↑ that I tweeted about here:
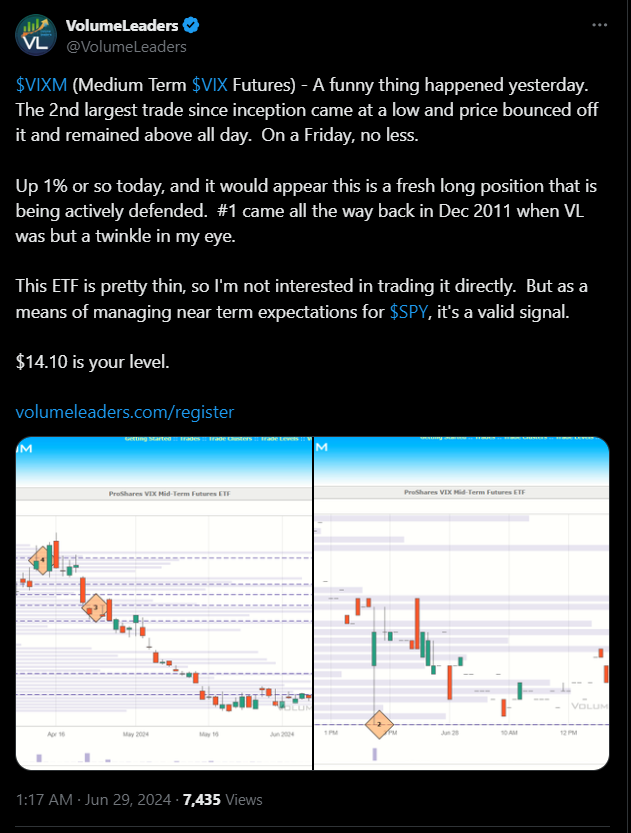
I’m not ringing the alarm bells but this does command some attention as it may portend some early weakness in the markets. Keep an eye on price relative to the print and look for responsiveness at institutional levels above for an “all-clear” sign; members can login and view the price levels here
Middle Pane/TPO: Not much new here…the consolidative behavior will naturally leave behind the kind of poor structure we’re seeing as aggression at the edges turns off and price mean-reverts until the auction has a compelling reason to leave value/balance and go seek it somewhere else.
Bottom Pane / 30m: 30-day POC is sitting at the highs. This puts a lot of pressure on bulls to move price up, otherwise we can see a lot of late-long positioning become supply and unwind in a downward move as people are pressured from positions. In past stacks I’ve mentioned how price very frequently has a tendency to move in extensions; consolidative behavior is especially useful at ATH’s because, in the event that price extends up, there is no prior structure to lean on when looking left. We’ve got, roughly, $4-price-extensions and in yet another uncanny display of market symmetry, line up nicely on the down with the middle of the LVN underneath at $538.65 created by the unfilled bull gap and then 1 extension below that lines up with prior POC, big prints and perfectly nails that HVN at $534.58. Topside extensions are $550.88 and $554.96. Further extensions can be derived with some simple math if desired.
Invesco QQQ Trust, Series 1 QQQ
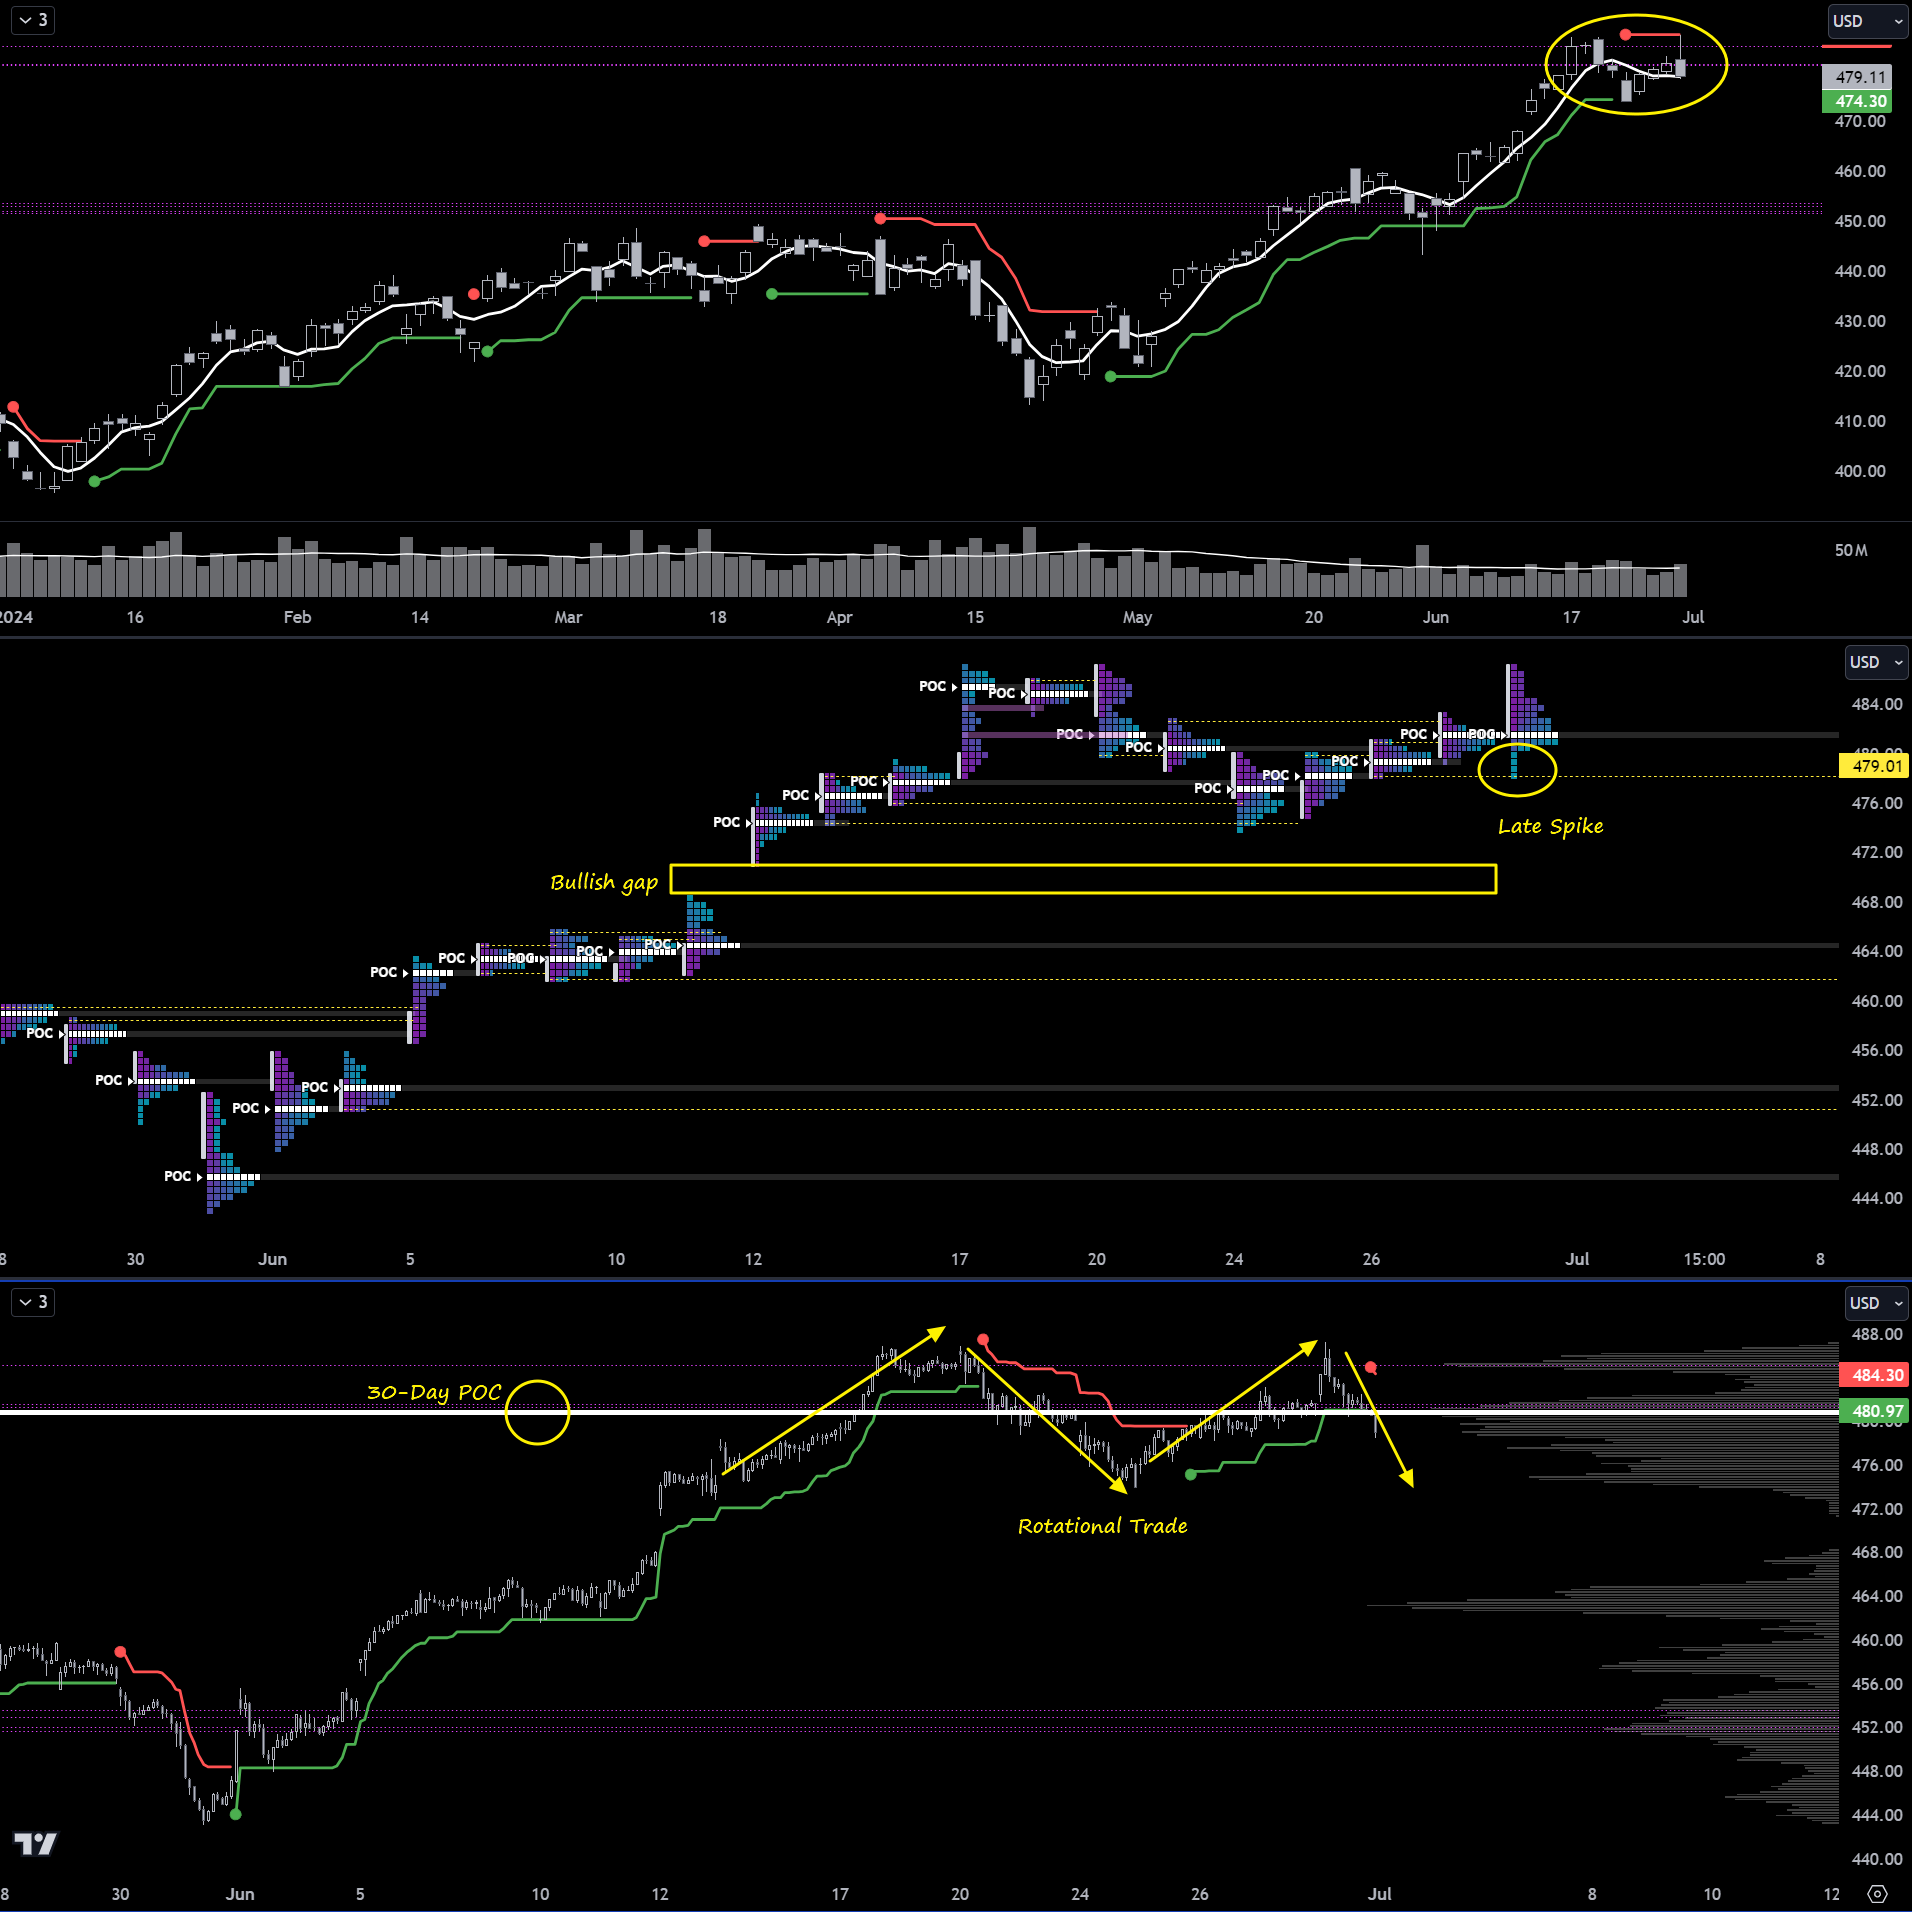
Top Pane/Daily: Last week I was very clear about looking for weakness early in the week. The weakness only persisted one session (Monday) but the daily close under $474.30 was enough to violate the bullish Supertrend LIS. I also warned that the early weakness would not persist and since then, we’ve rotated back up to test the now-bearish Supertrend LIS at $487.33. A daily close outside of these levels interests me for higher timeframe continuation but as things stand now, we are looking at a balanced market. I did incorrectly suggest that PCE would be the impetus to seek fair value somewhere else and that did not materialize. What does that leave us with? More balance. If breadth continues to improve and money in the market broadens-out while major indices balance, this is likely a sign of strength and we continue to move higher. Make you login to VL to see where the #11 and #12 ranked prints came in.
Middle Pane/TPO: Little to discuss here. $480.97 is currently in control which means that when price gets too far away on the top side, we’ll sell back to it; when price gets too far away to the downside, we’ll buy back to it - mean reversion. We do have a late spike so I’ll be watching to see where we open in relation to the spike. Opening under $479 would be a good sign for sellers; opening above $480 would be good for buyers; anywhere in the middle and we’ll get some two-way tape before a move out of the spike.
Lower Pane/30m: We’re a good deal away from the institutional levels down around $452. If you login to VL, you’ll see another important cluster below those worth noting on your charts. 30-Day POC is here at the highs and one would expect $464 to be supportive if we sold. The market rotations are pretty clear on this view. When the market is balanced, you want to be patient and play from the outside-in. If price is outside the box and consolidating, look out for price expansion. That is, if you price in a tight range at the top of the box, favor longs; if you see price winding up at the lows, favor shorts.
IShares Russell 2000 ETFIWM
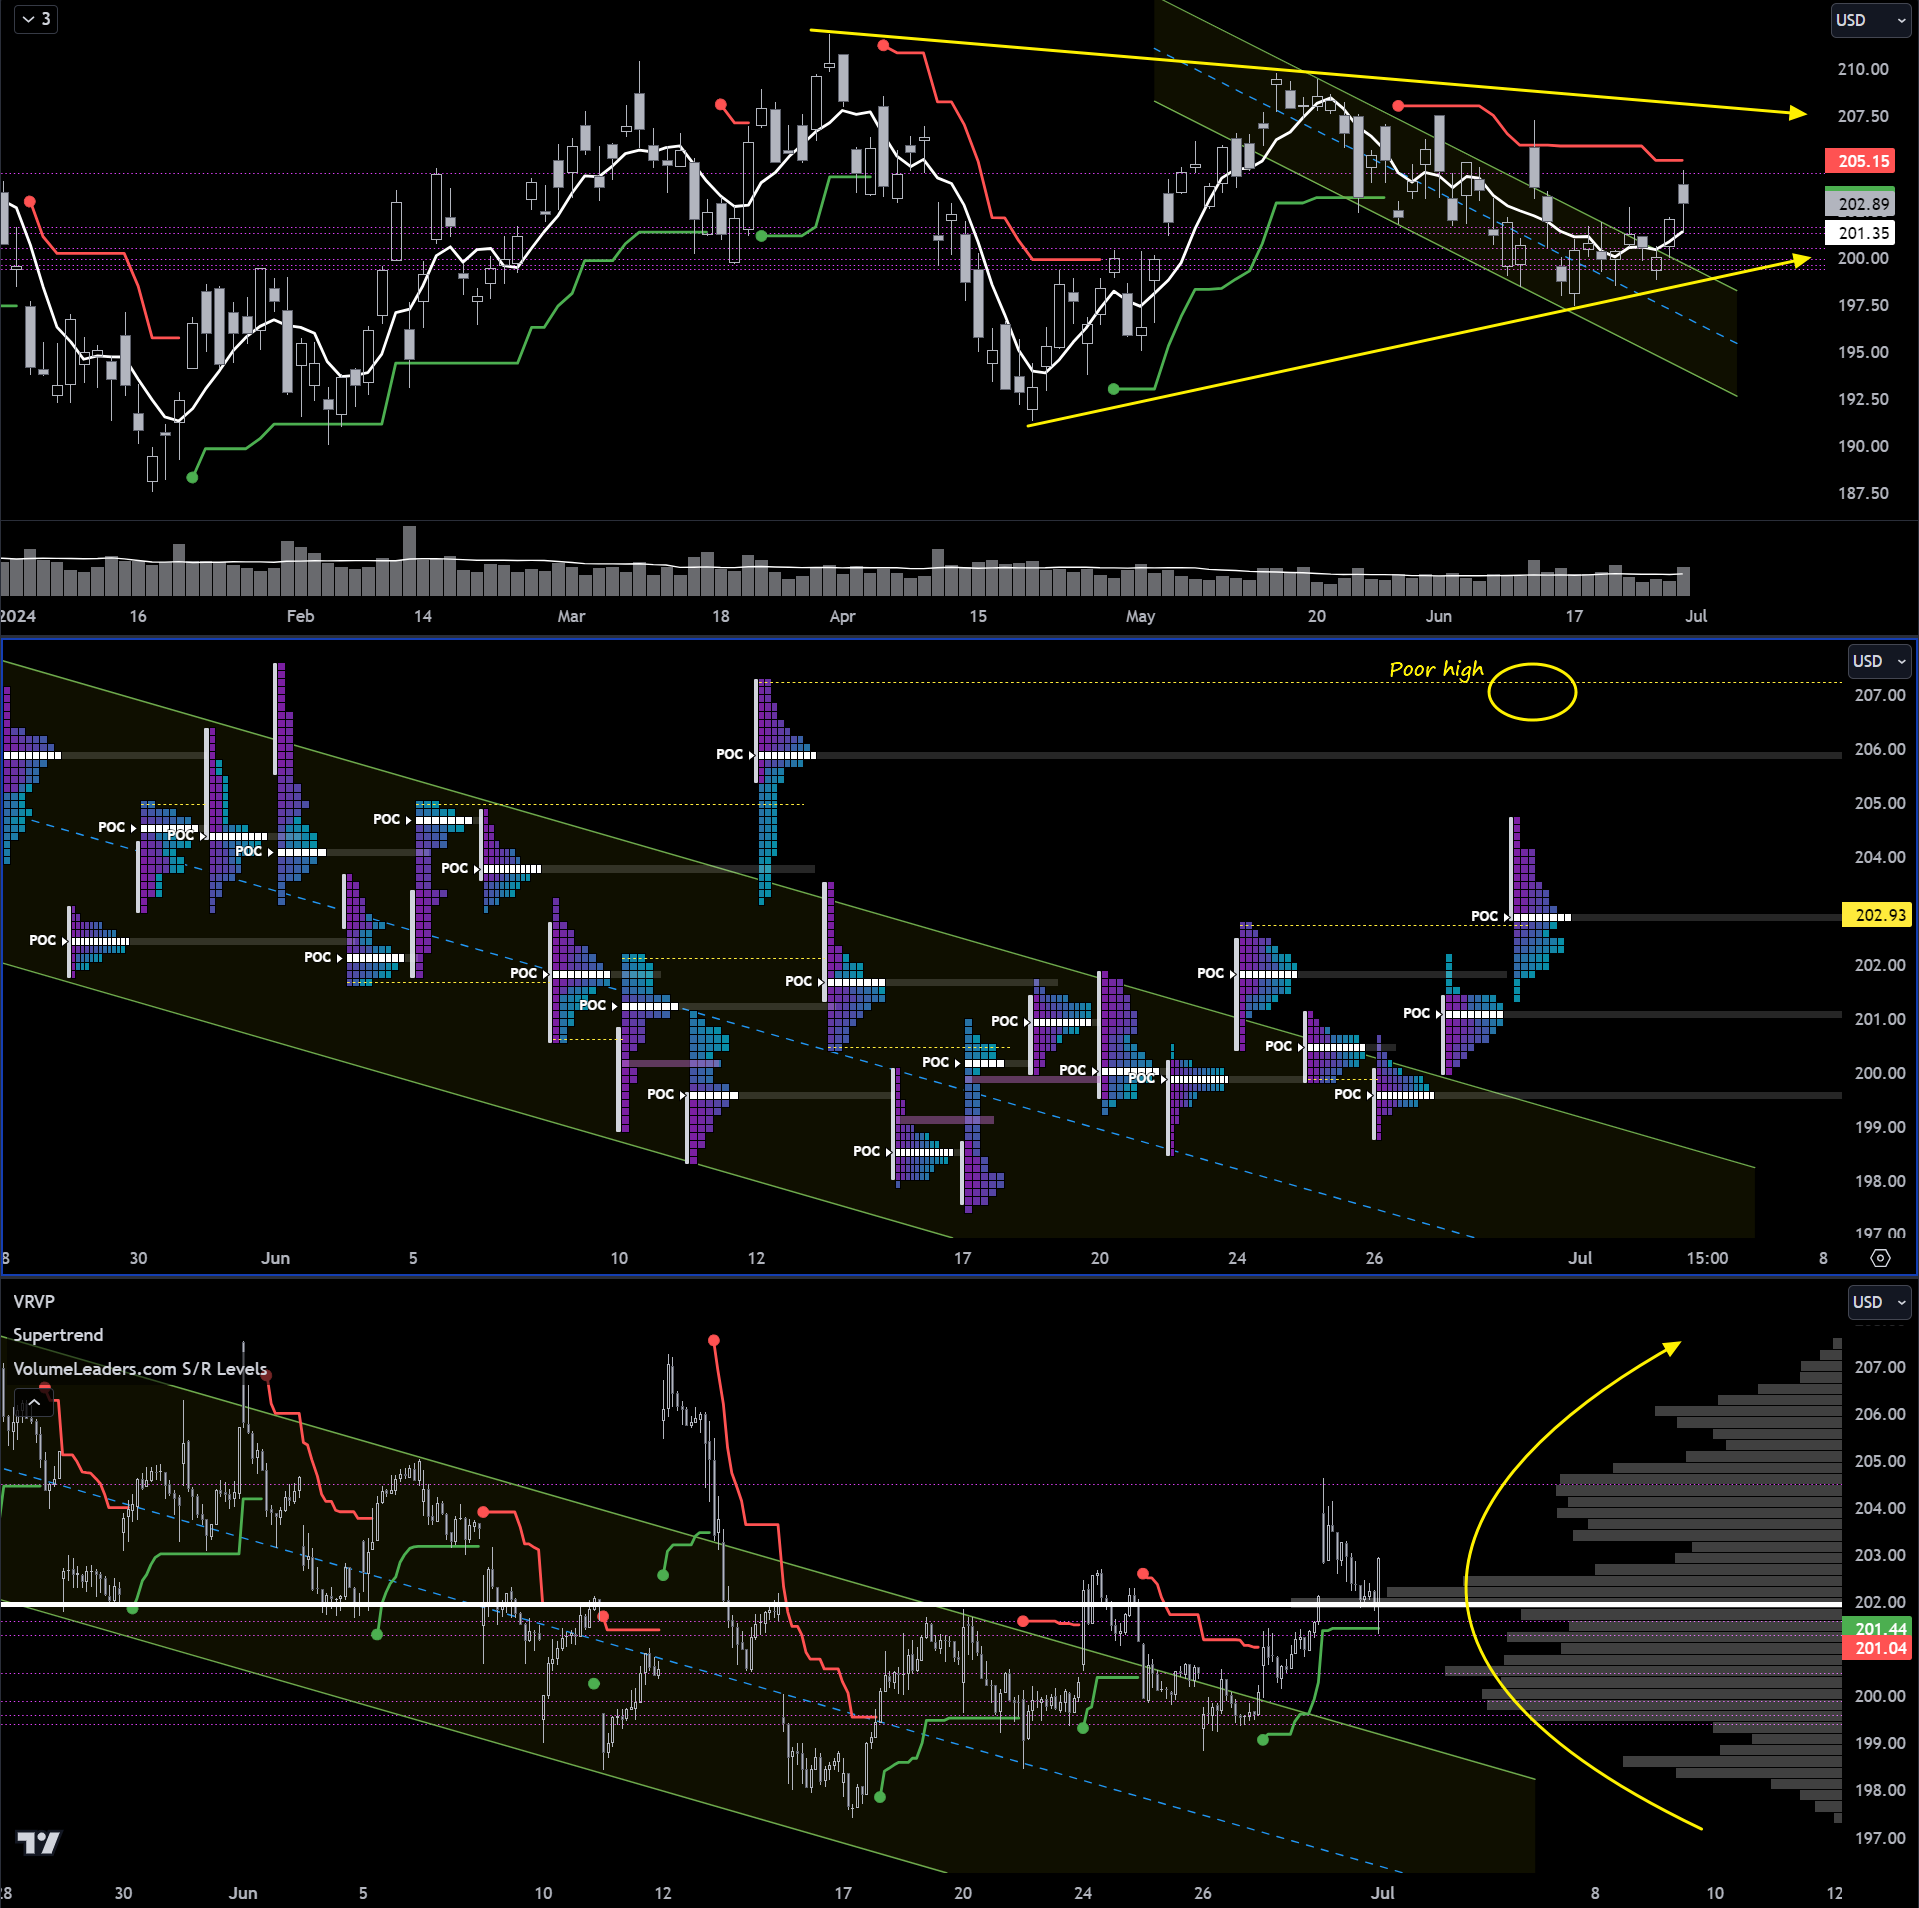
Top Pane/Daily: Price keeps coiling and the ranges shrinking as this thing is giving the impression it’s going to make a large move. Last week I called for longs into prior prints (visible in VL and prior stacks) if we saw a sideways distribution of price out of the channel. This thing will very soon be too tight to play directionally for lower time frame traders but as long as institutional involvement is under price and we’re closing above the 5DMA, I have to say I still like longs.
Middle Pane/TPO: Not much here to look at. Poor high up at $207.22. If the auction trades there, it’ll find itself at the top of the consolidation wedge as well and plenty of unchecked POCs underneath to revisit if consolidation persists.
Bottom Pane/30m: Profile suggests the fairest price is $202. I’ve noted before how chop will render momentum indicators like Supertrend broadly useless and chop is just what we’d expect in a bell curve shaped profile like this.
SPDR Dow Jones Industrial Average ETF DIA
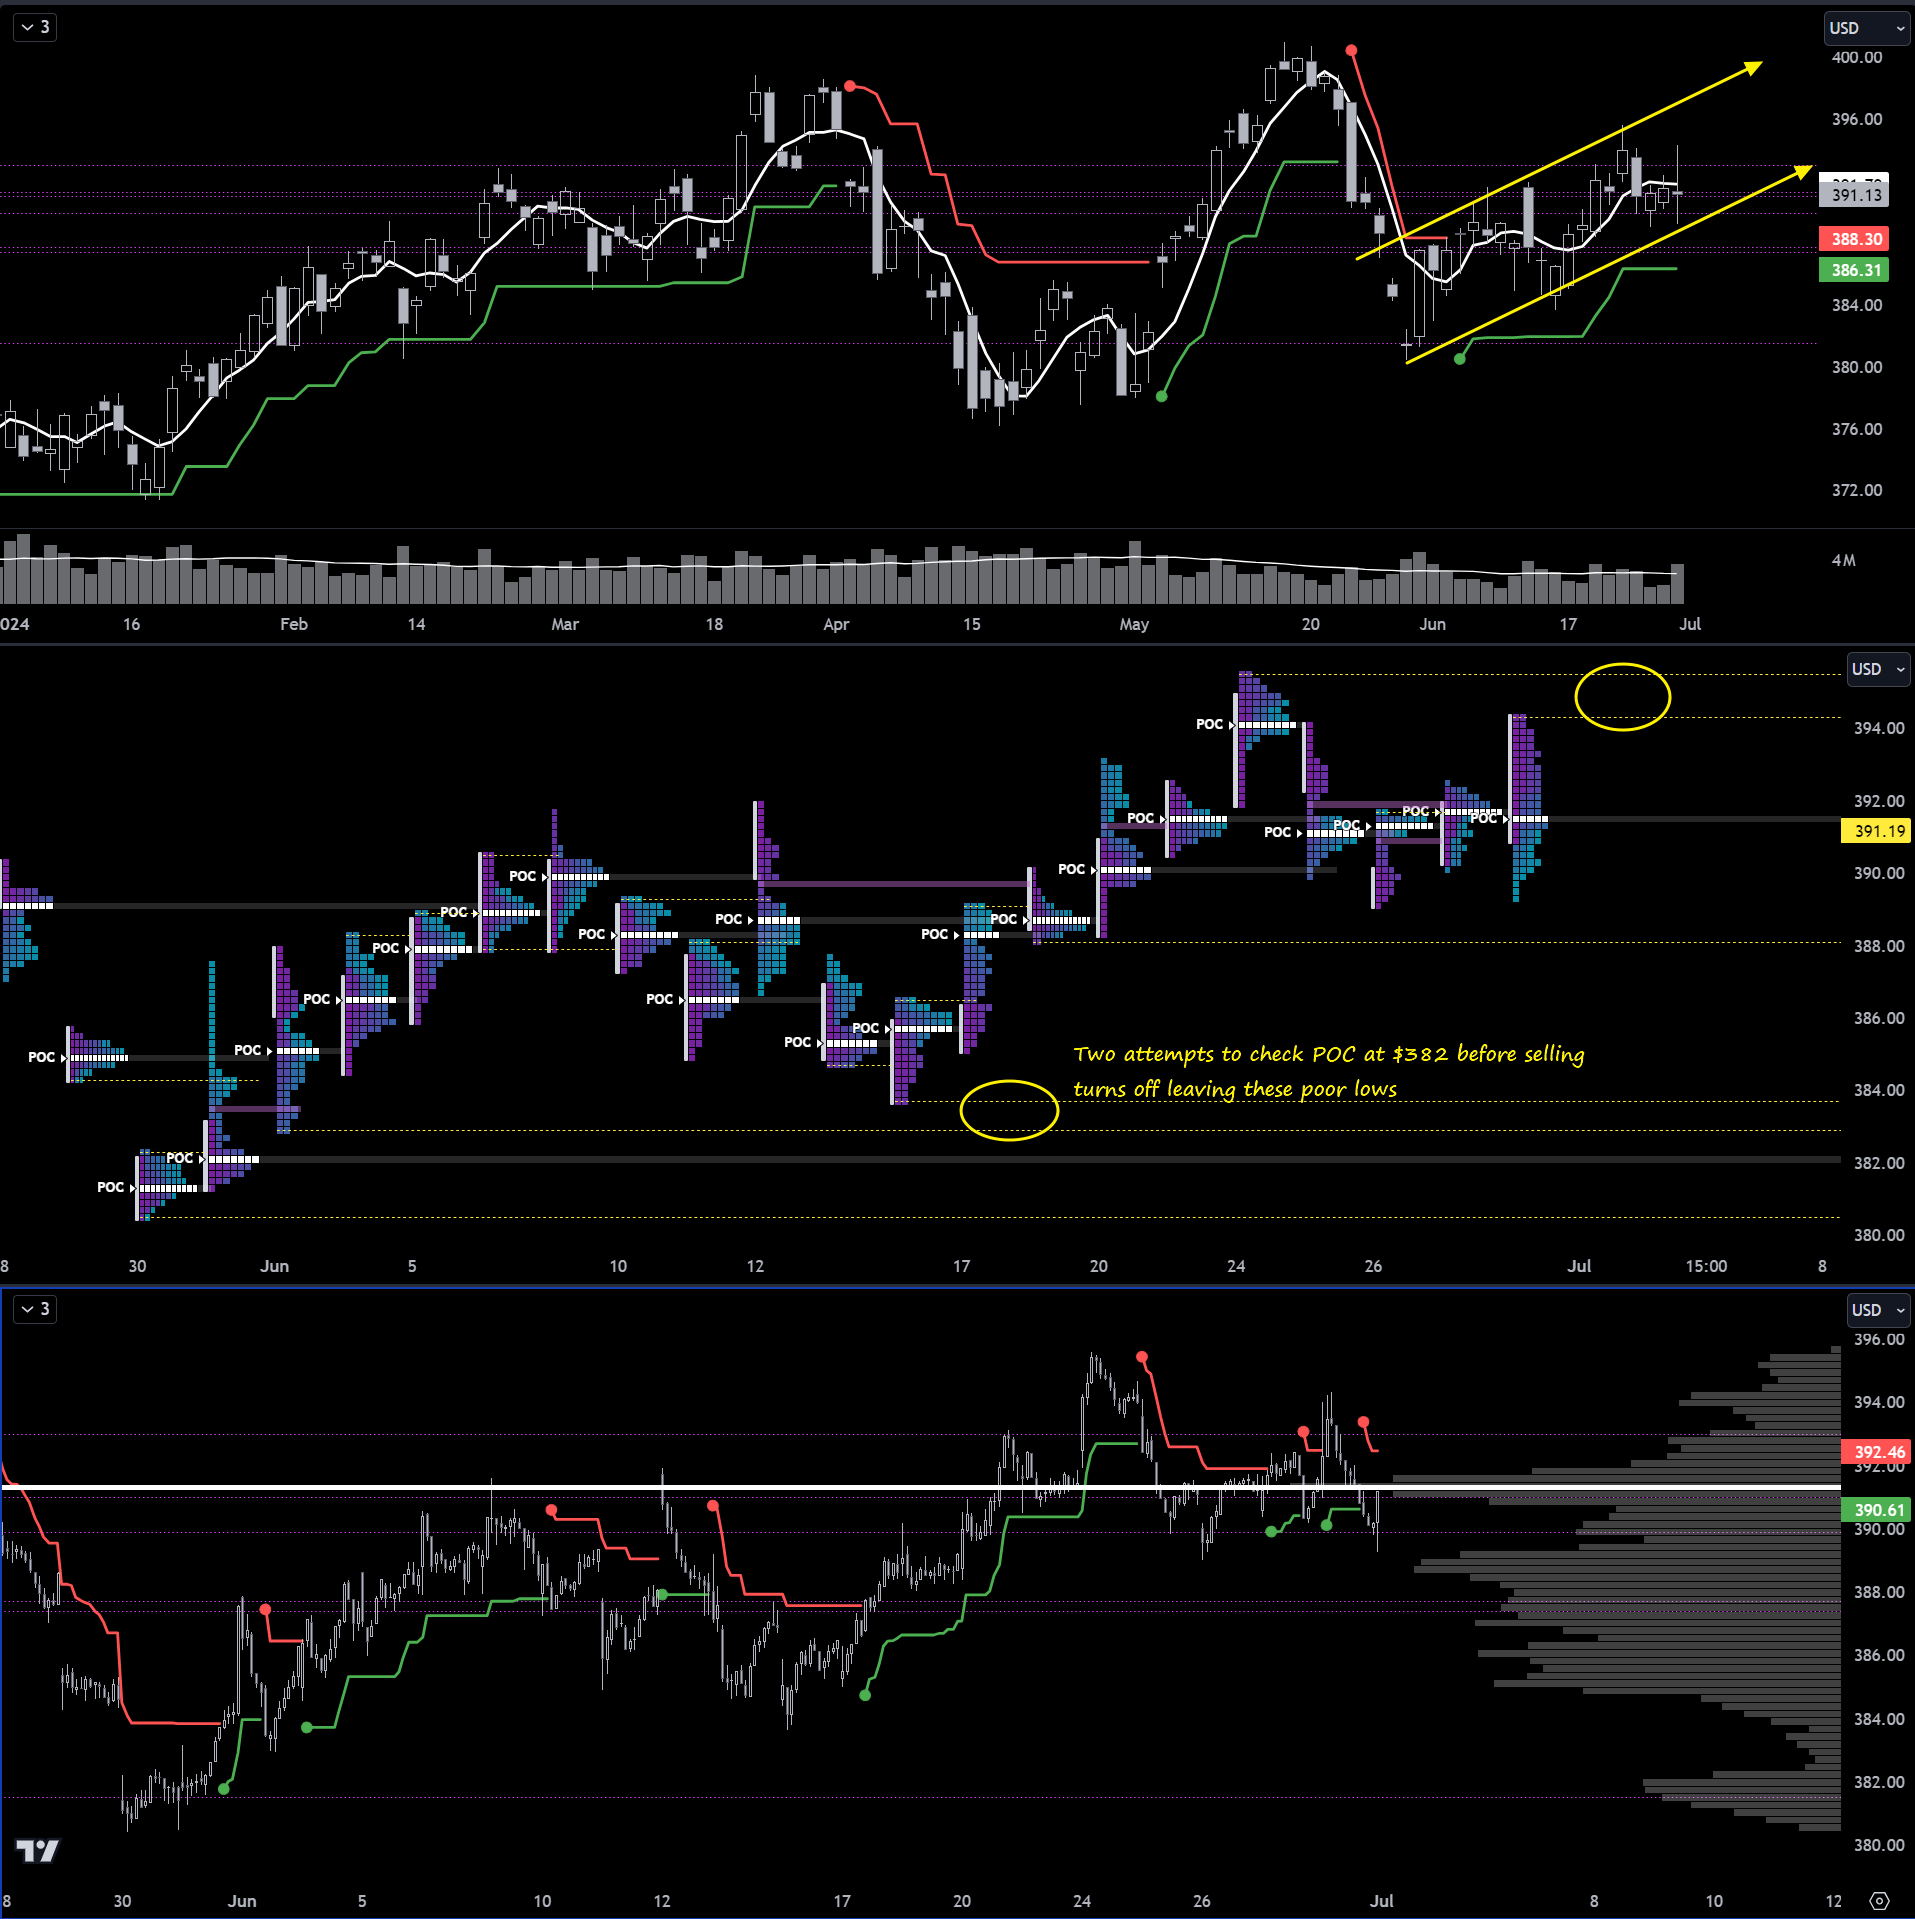
Top Pane/Daily: Bull thesis still in tact and price pausing last week to move sideways into the bottom of the channel. If price can find it’s way back above the 5DMA, expect more intraday strength that’s easier to ride long than the Q’s right now. As you can see, June’s monthly candle closed out inside and on daily timeframes or higher there are two good trades to watch for: the break of the inside candle give you a breakout trade but if the breakout fails and the side of the candle that broke is reclaimed, expect to see the other side of the inside candle taken out.
Middle Pane/TPO: Structure to clean-up on both sides of price right now. An interesting auction anomaly noted down at $382-$384 suggesting institutional guidance toward a destination, it’s just not clear to me where that is. Nearest poor low holding price action over the past week is at $388; to the topside $394.31 and $395.48
Lower Pane/30m: 30-Day POC is at $391.35’ish…if price slips under and is testing this POC from underneath with no acceptance above, I would start to have concerns. The clustering of the institutional levels and the bell-curve shape of the profile and the inside-month pattern bear much resemblance to IWM…no idea if it matters.
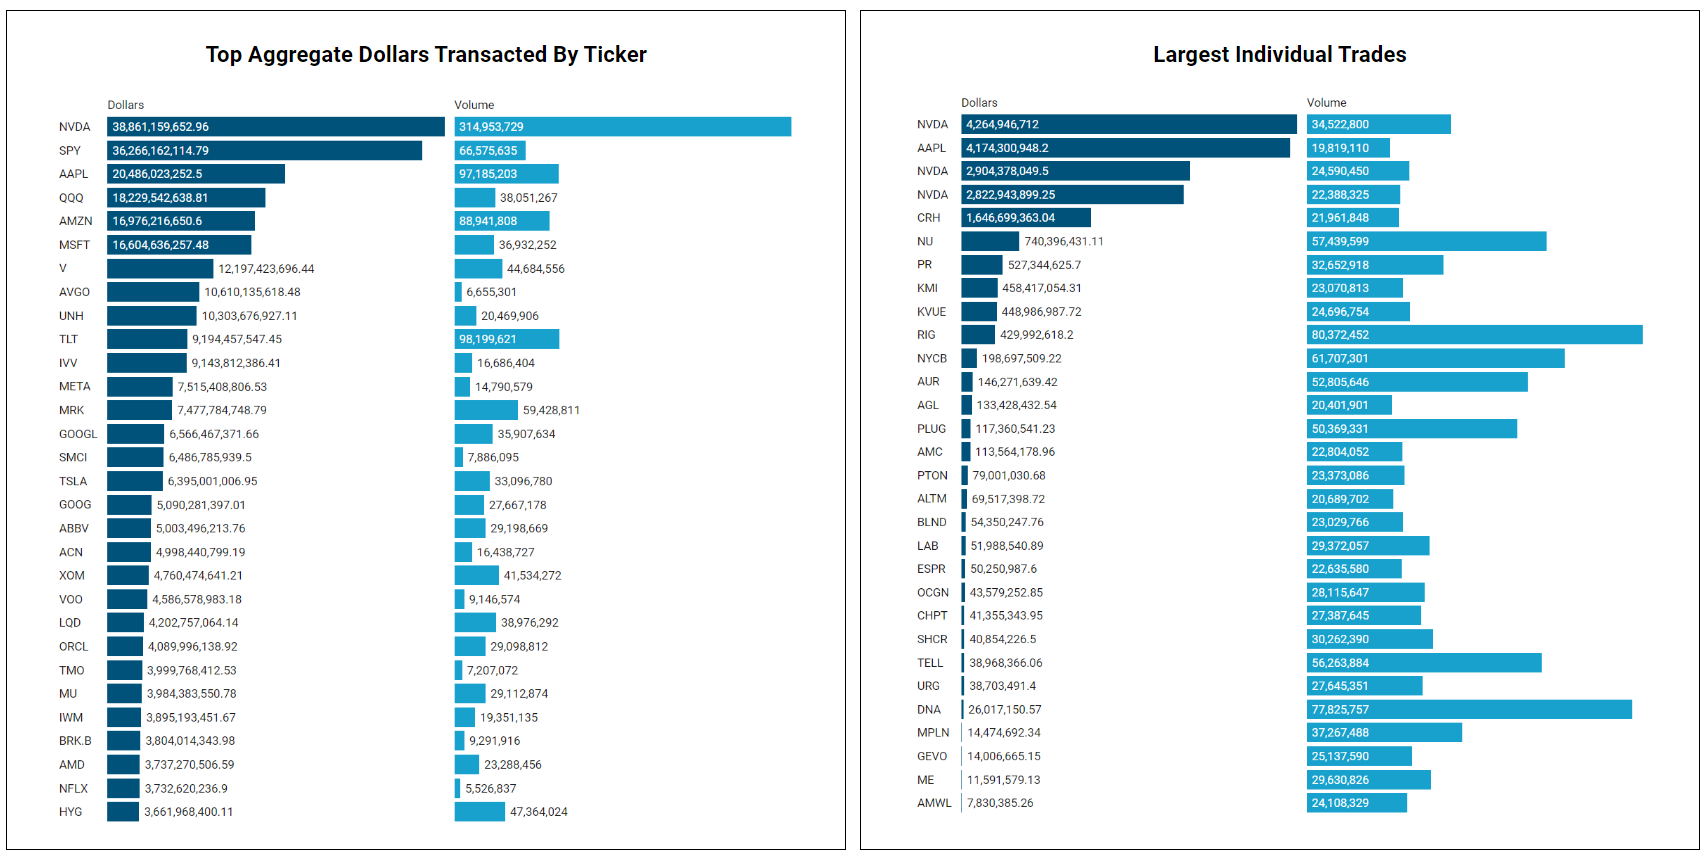
Top Institutional Order Flow
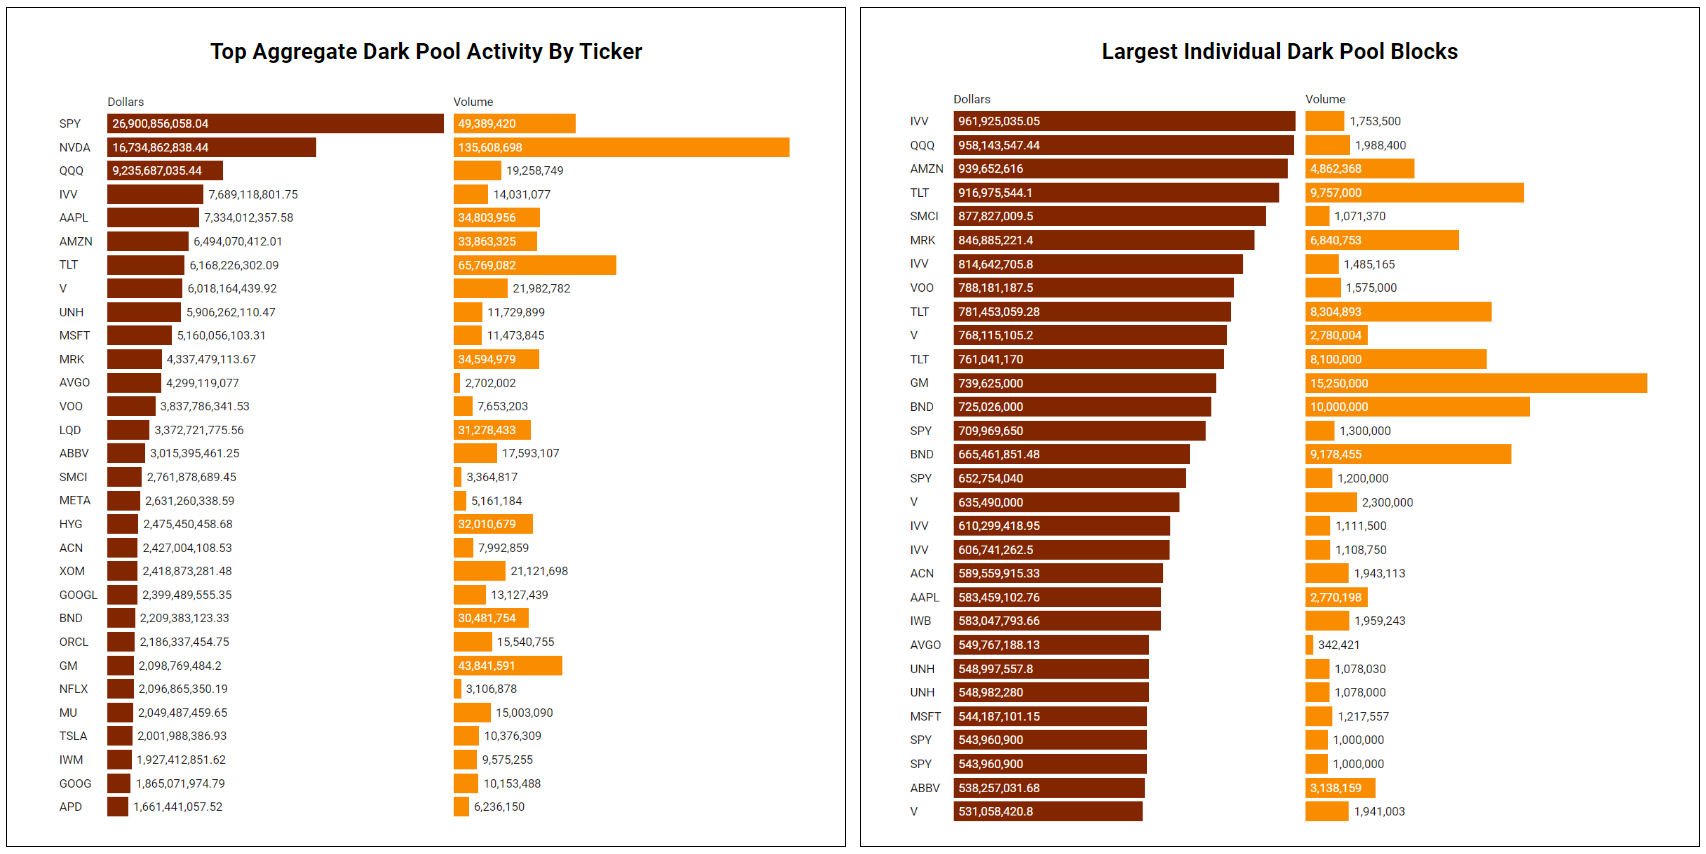
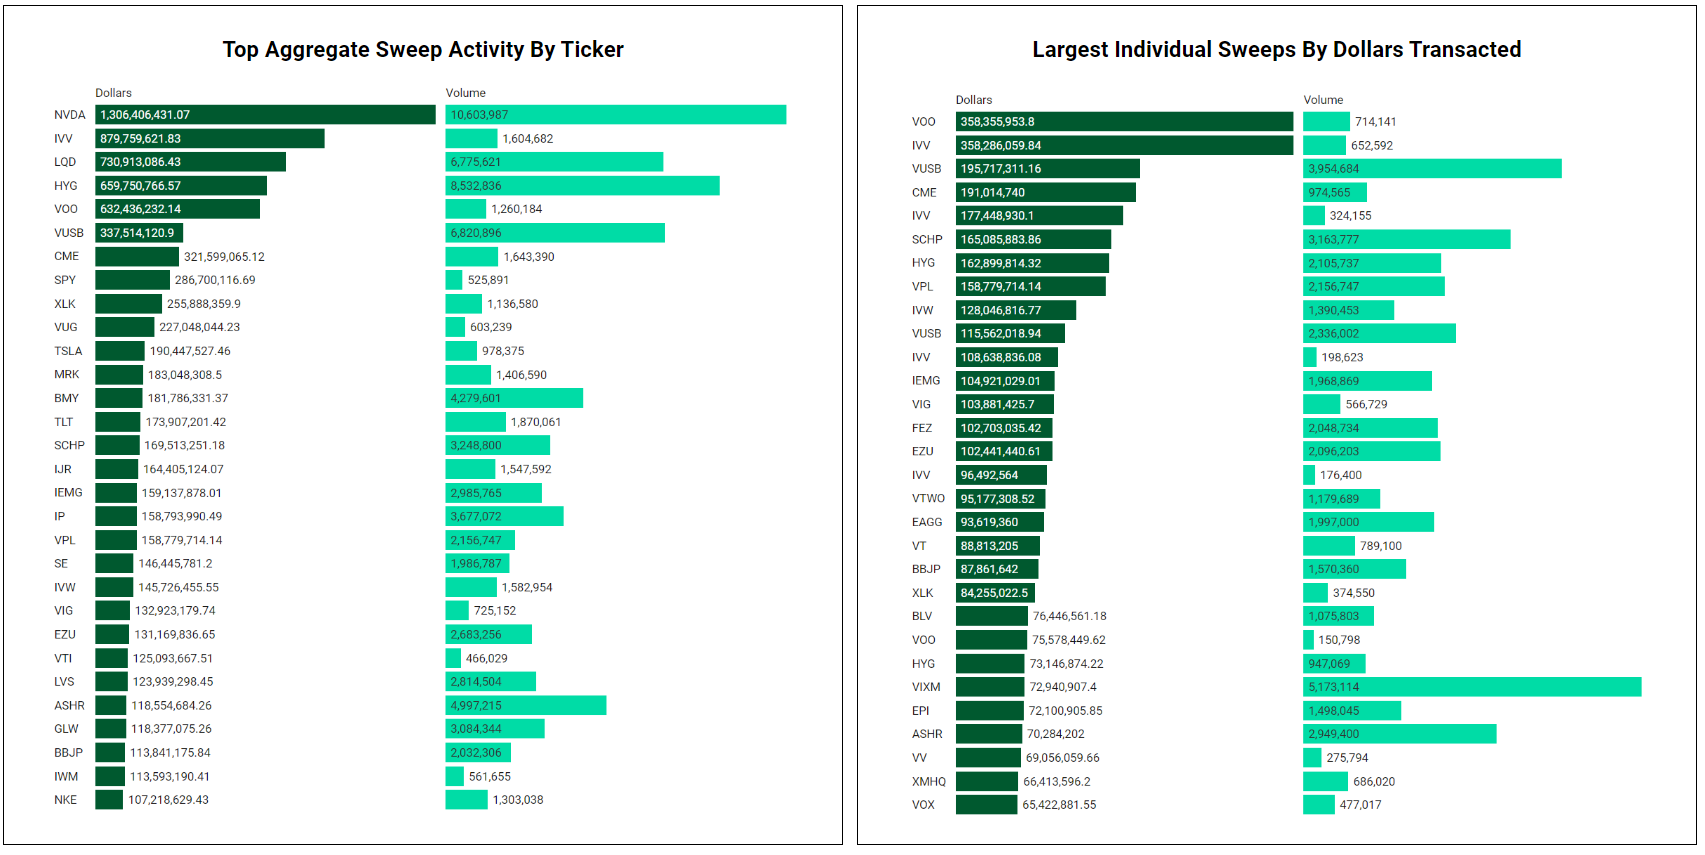
There are often great trades ideas or sources for inspiration in these prints. Only the top 30 of each group are shown but the full results are available in VL for you to browse at your leisure. Don’t forget to setup real-time alerts inside the platform so you never miss institutional order flow that piques your interest. Blue charts include all trade types including blocks on lit exchanges; red/orange charts are dark pool only trades; green charts are sweeps only.
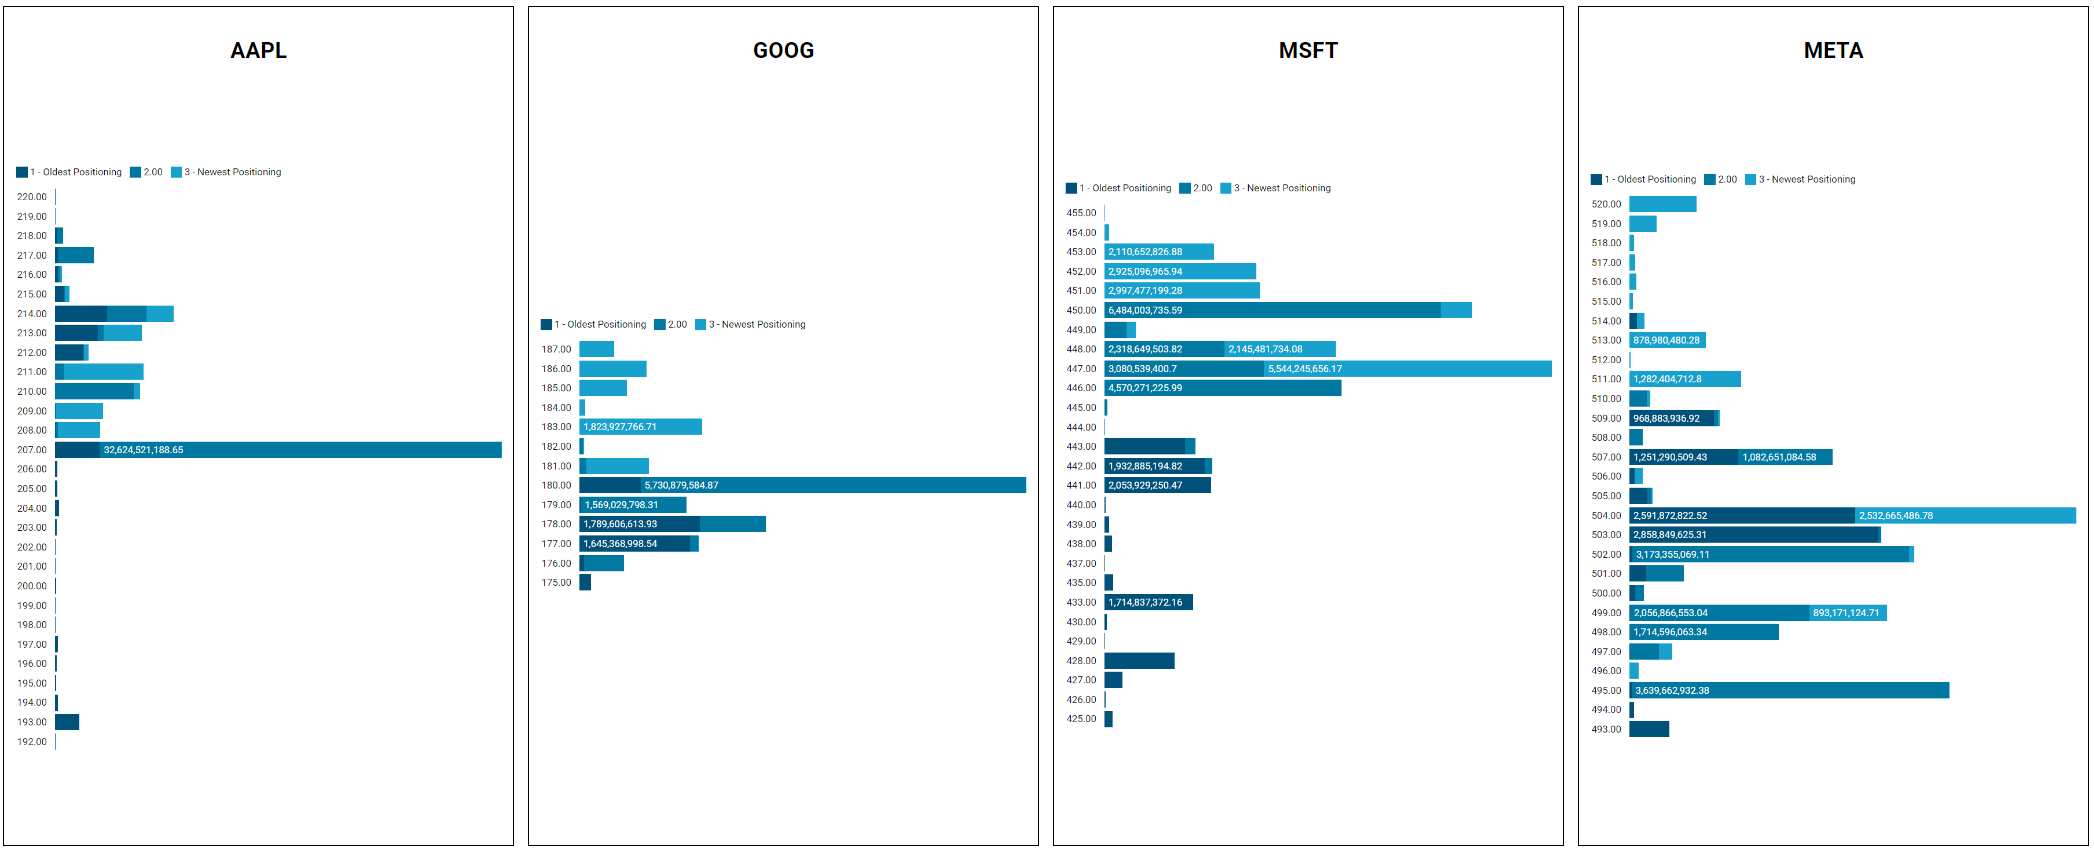
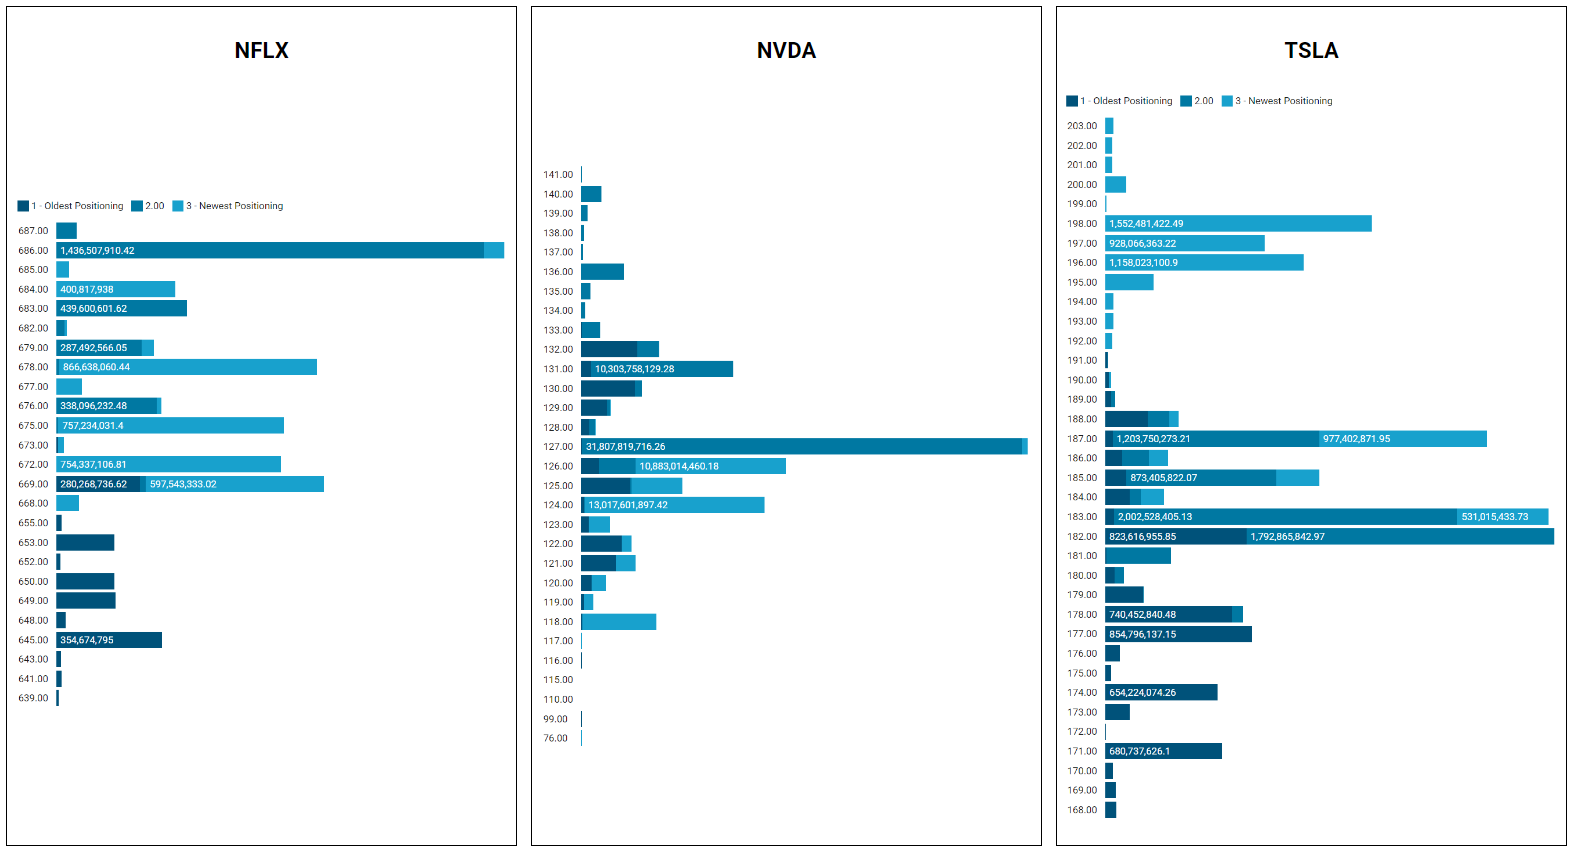
MoneyFlow Charts
When we look at moneyflow charts, we’re visualizing the aggregate institutional activity by price for a given period. The benefit of moneyflow charts is that you have an apples-to-apples comparison of institutional involvement across the entire market because everything is measured by the same yardstick: dollars. If you are familiar with auction mechanics and volume profiling, you can apply the same principles here; large bars are magnets and show where business is being done and you can expect positioning to be tested and defended, sometimes multiple times; narrow bars represent little interest or less-success in doing business at that price and work as pass/fail levels to position and define risk against. A final note: the gradient in color represents the age of positioning; the darkest colors are roughly 3 weeks old and the lightest are the most recent week.
Indices
Mag7
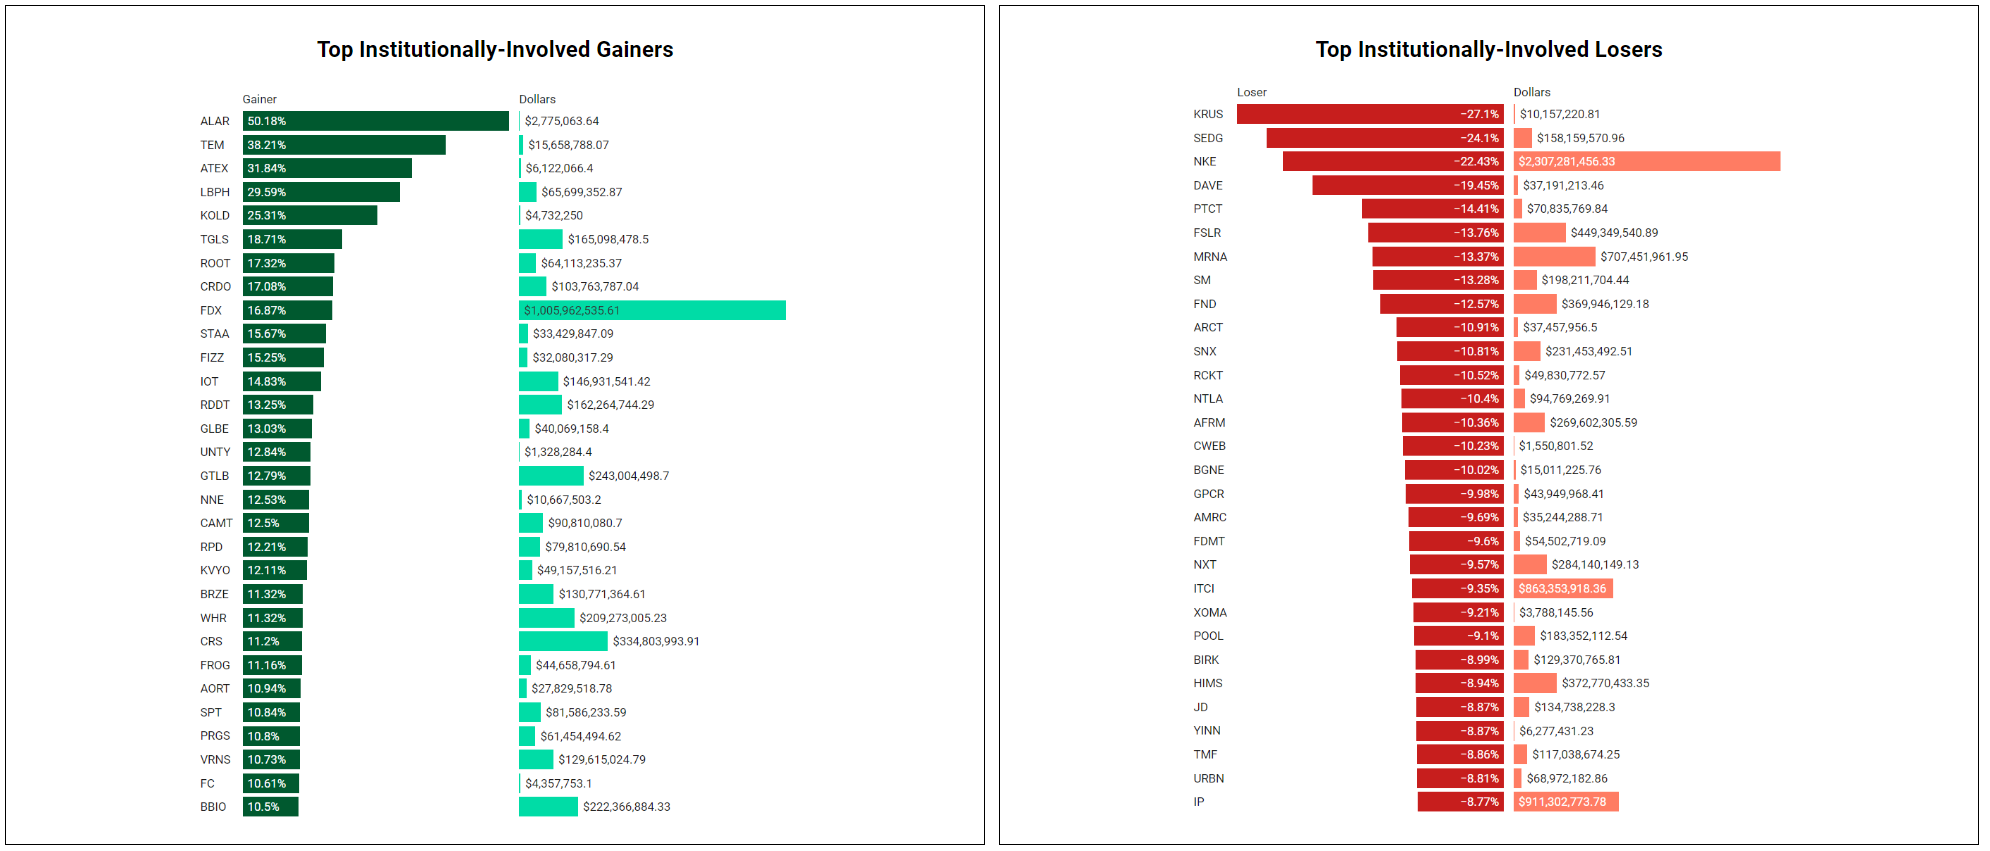
Institutionally-Backed Winners & Losers
If you’re going to bet on a horse, consider one that is officially endorsed by an institution! These are the top percent gainers (green) and and percent losers (red) from this week’s open-to-close that had a trade price greater than $20 and institutional involvement.
Billionaire Boys Club
If a ticker printed a new top-3 trade vs its entire trade history within the past week and the trade size was over $1B, it made the cut - welcome to the club. The table below is sortable, searchable and paginated (if there are enough results; some weeks are busier than others). Login to VL to get the exact trade price and relevant institutional levels around the trade.
Summary Of Thematic Performance
VL provides a lot of pre-built filters for thematics so that you can quickly dive into specific areas of the market. These performance overviews are provided here only for inspiration. Consider targeting leaders and/or laggards in the best and worst sectors, for example.
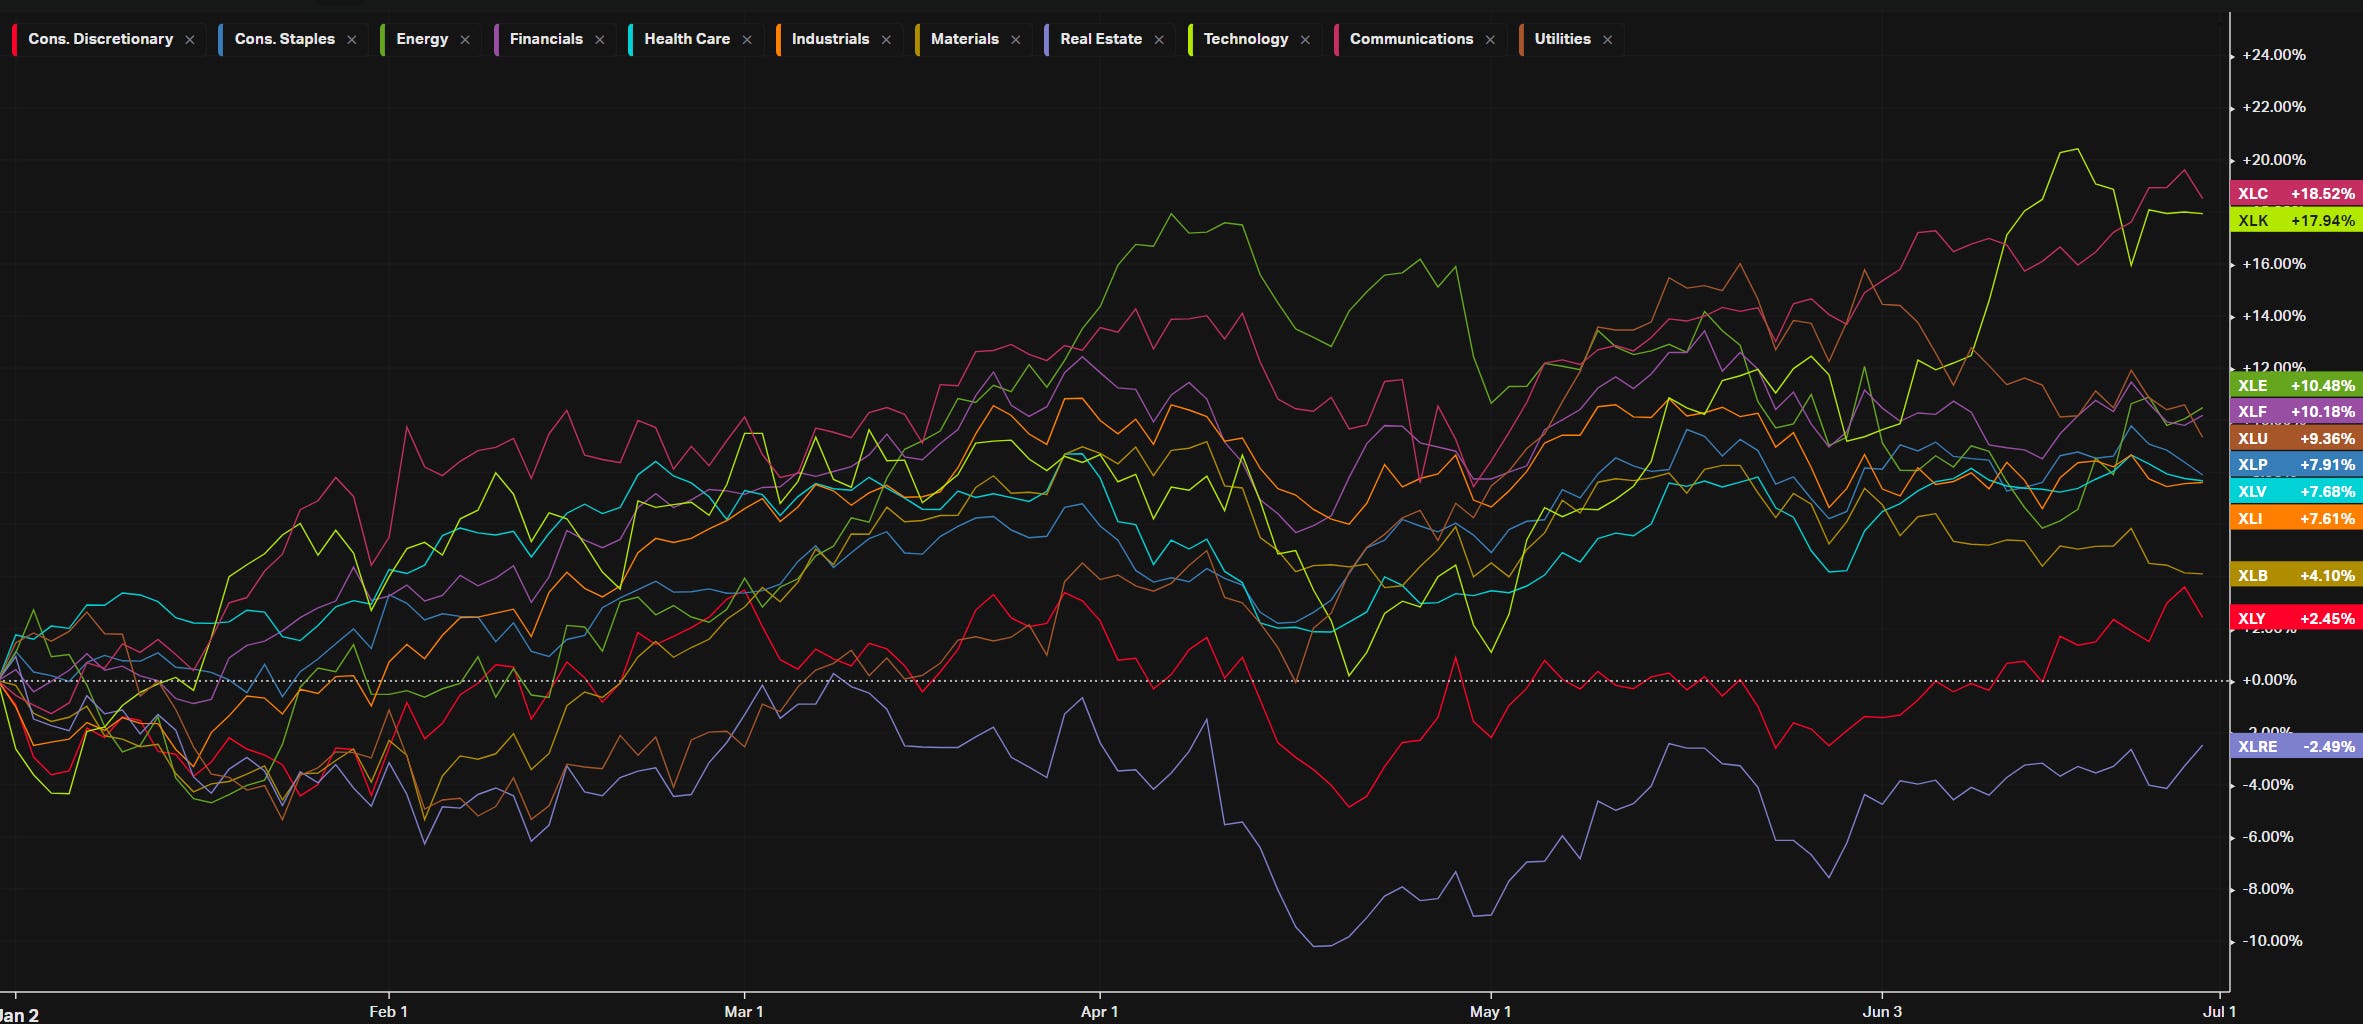
YTD S&P Sector Performance vs SPY (benchmark)
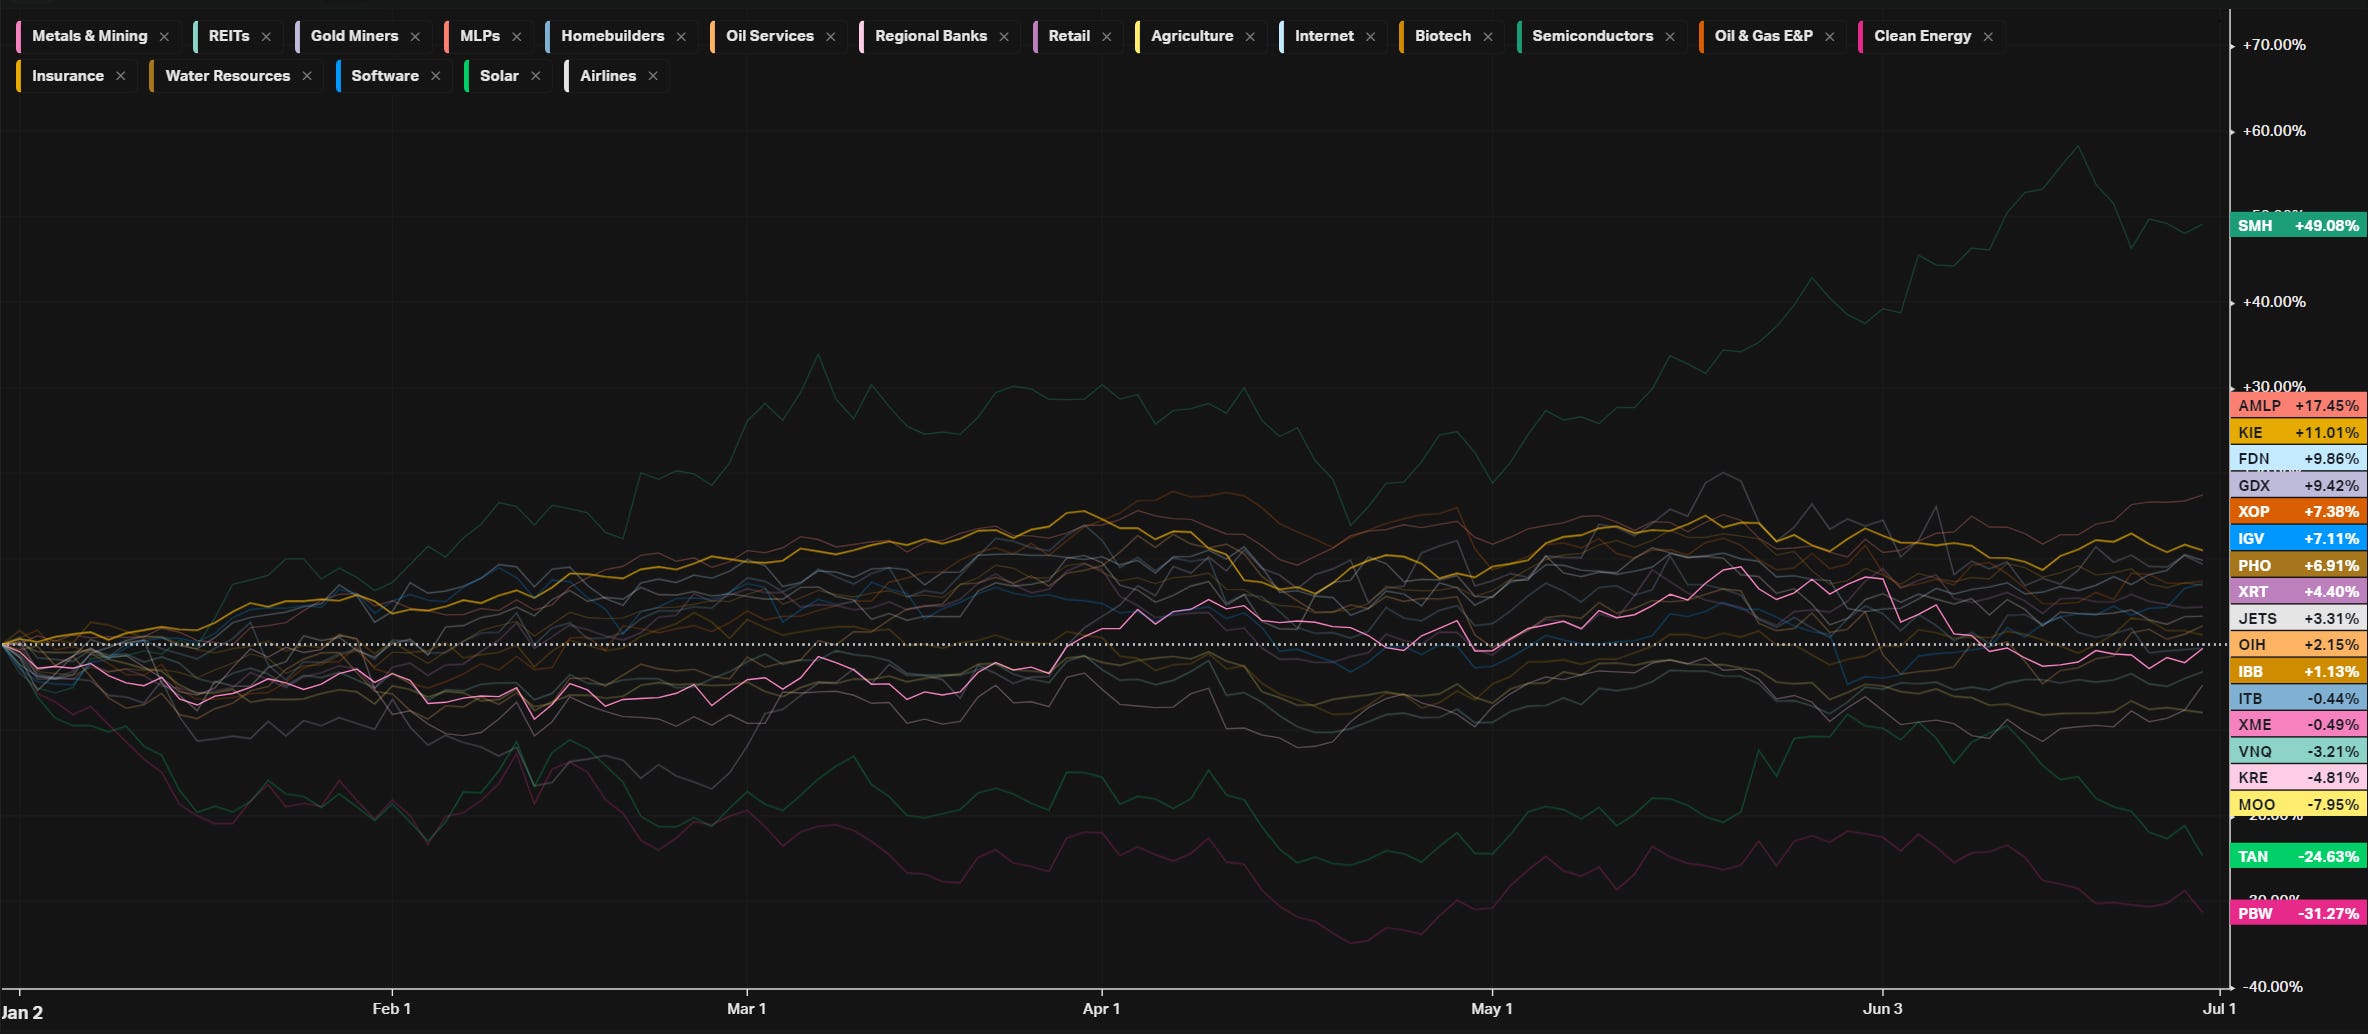
YTD S&P Industry Performance vs SPY (benchmark)
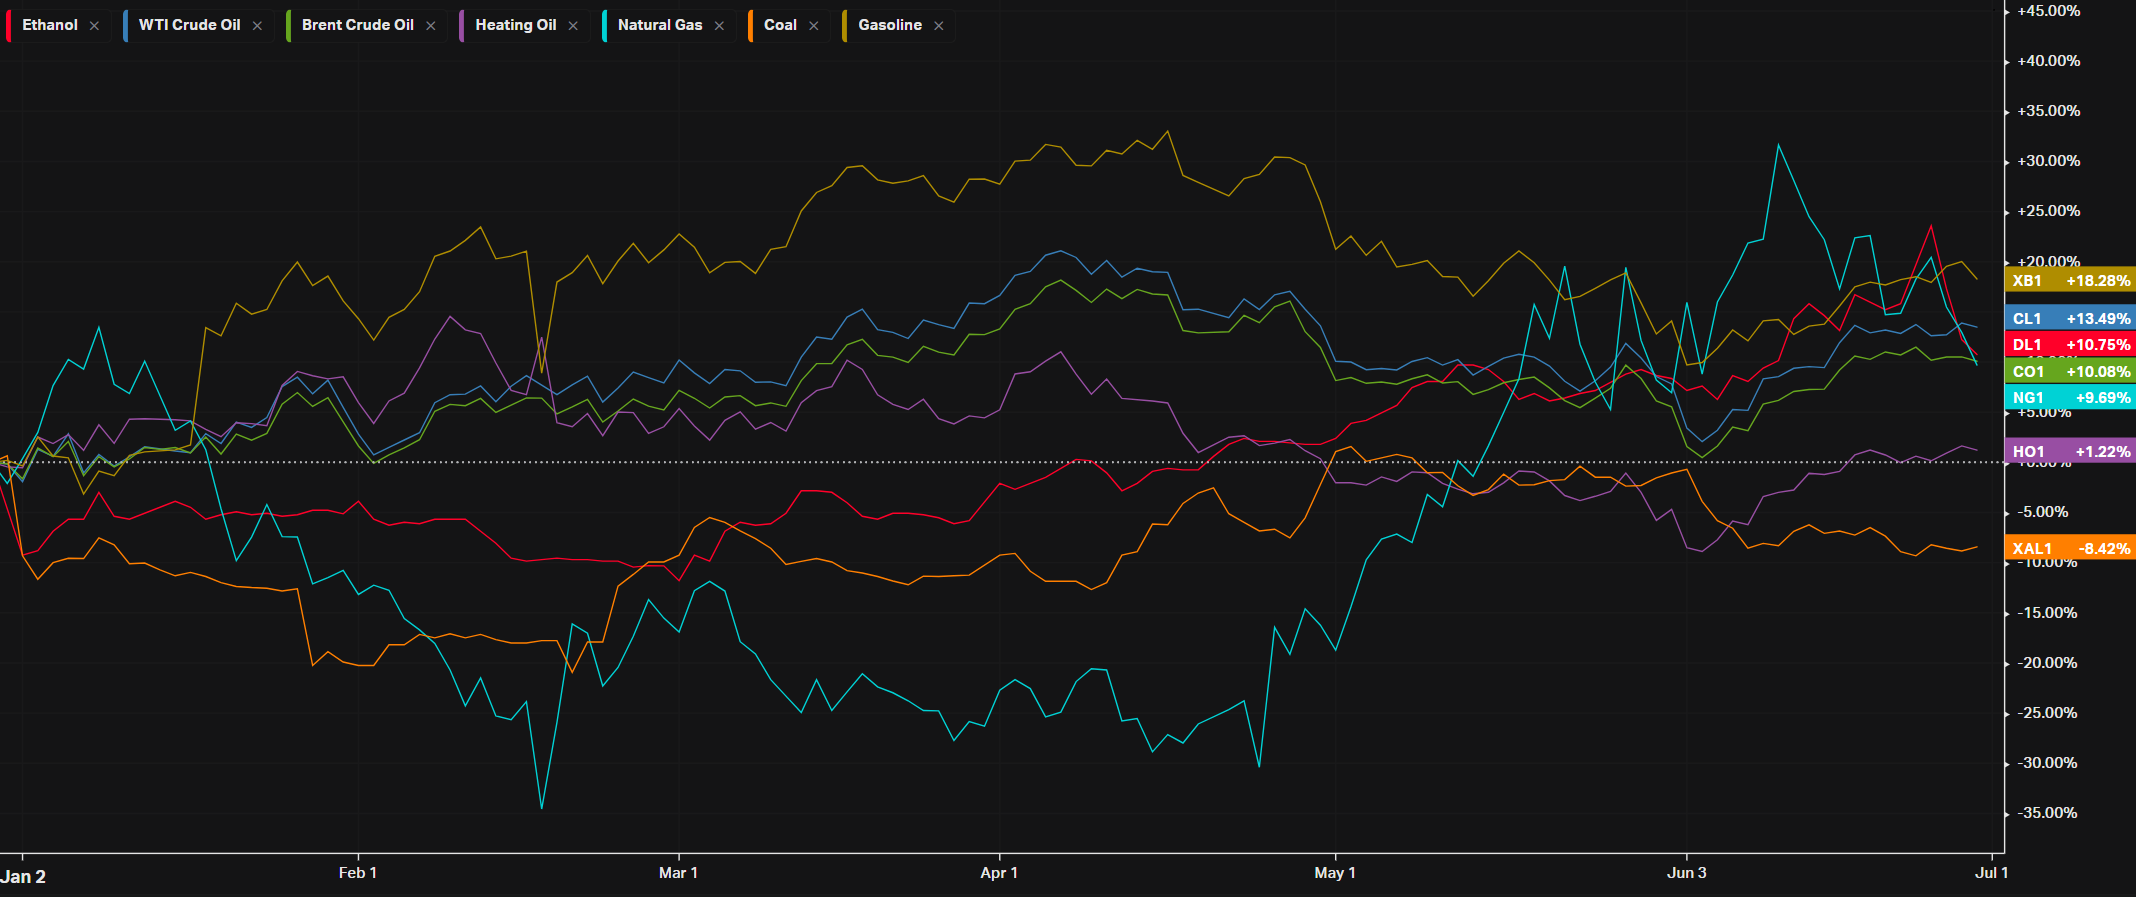
YTD Performance: Energy
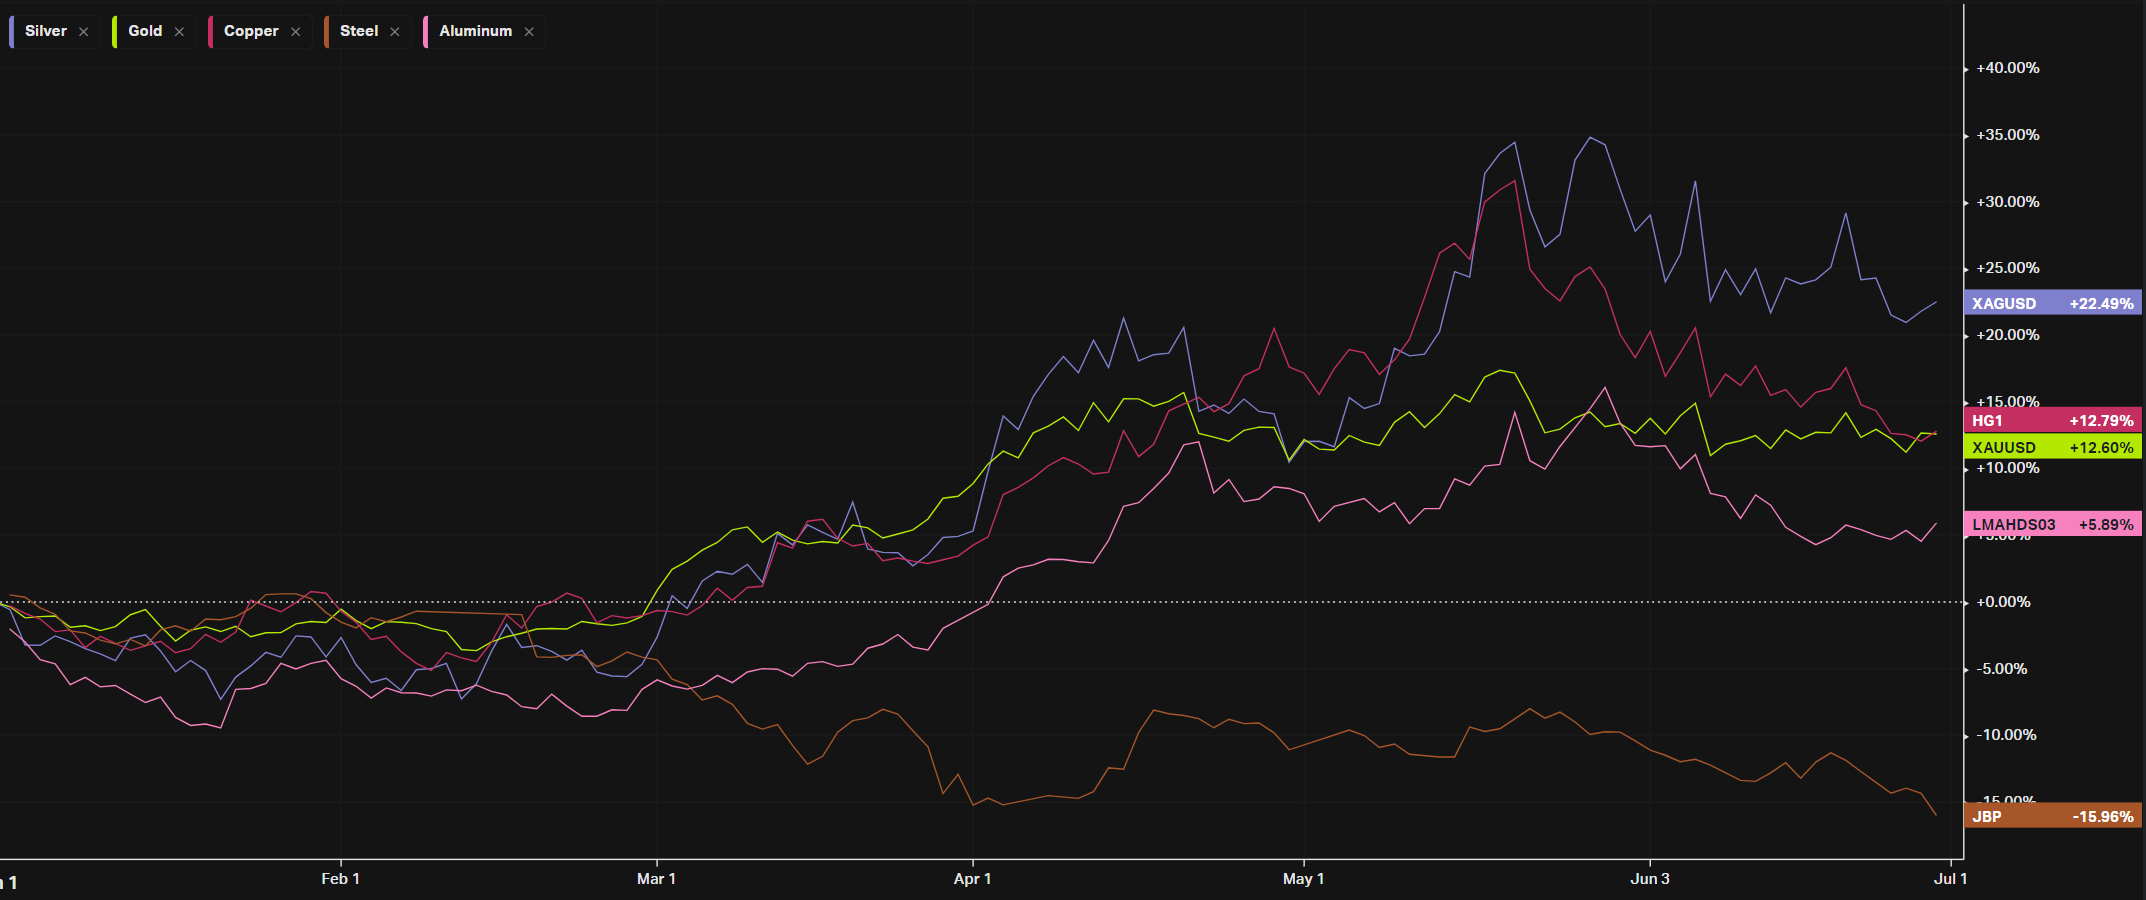
YTD Performance: Metals
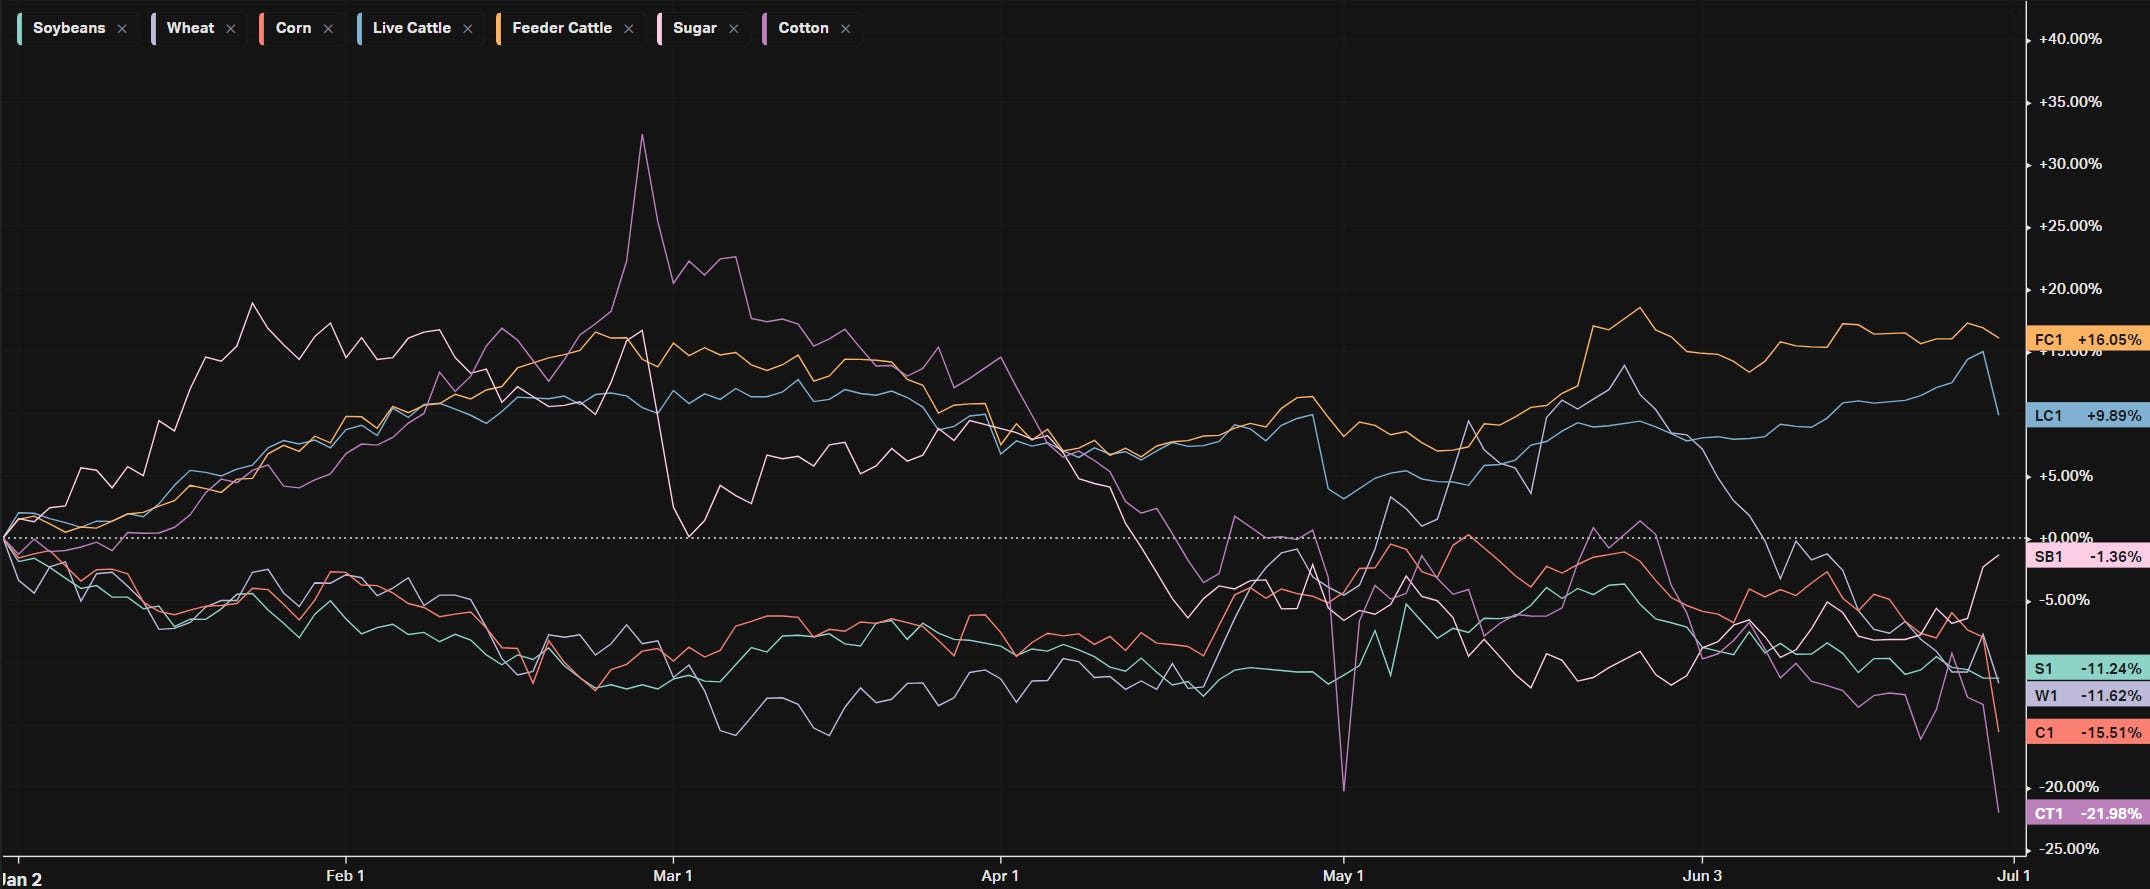
YTD Performance: Agriculture
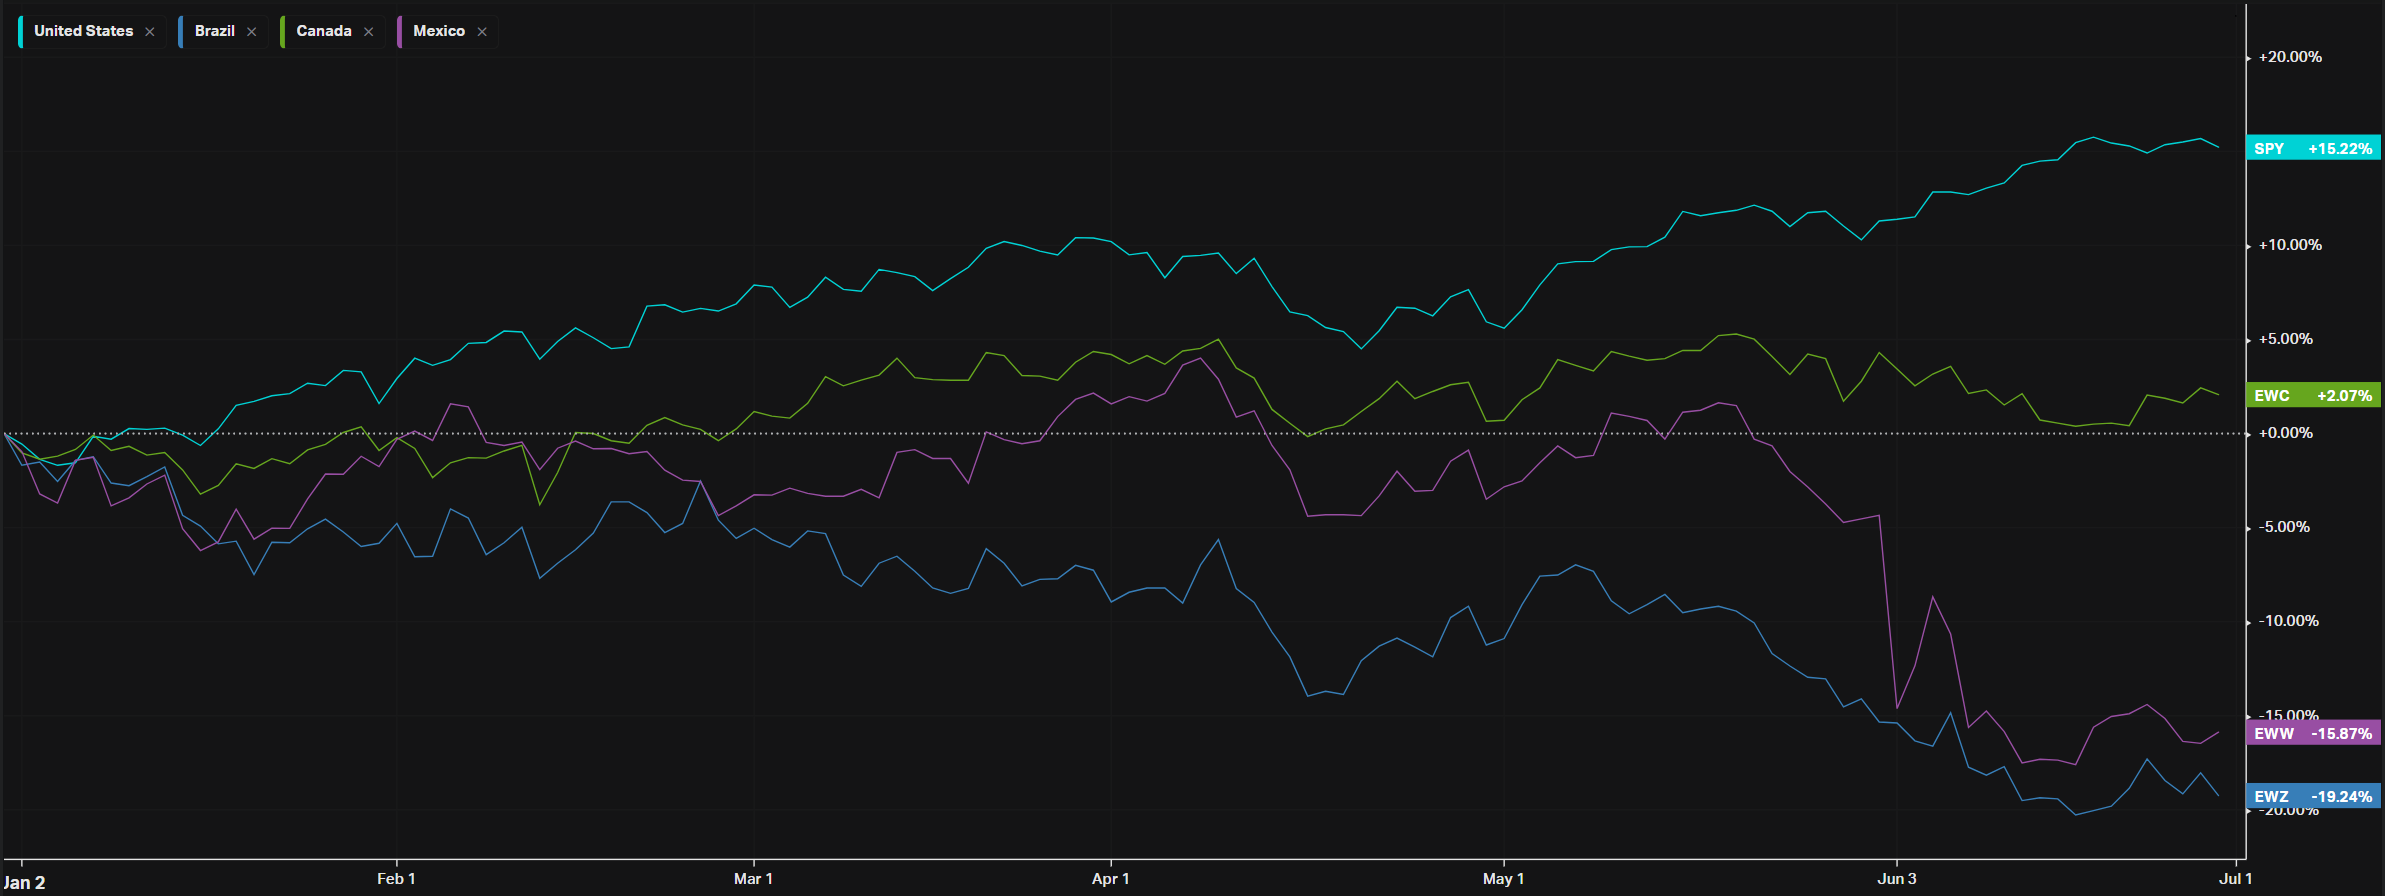
YTD Performance: Country ETFs
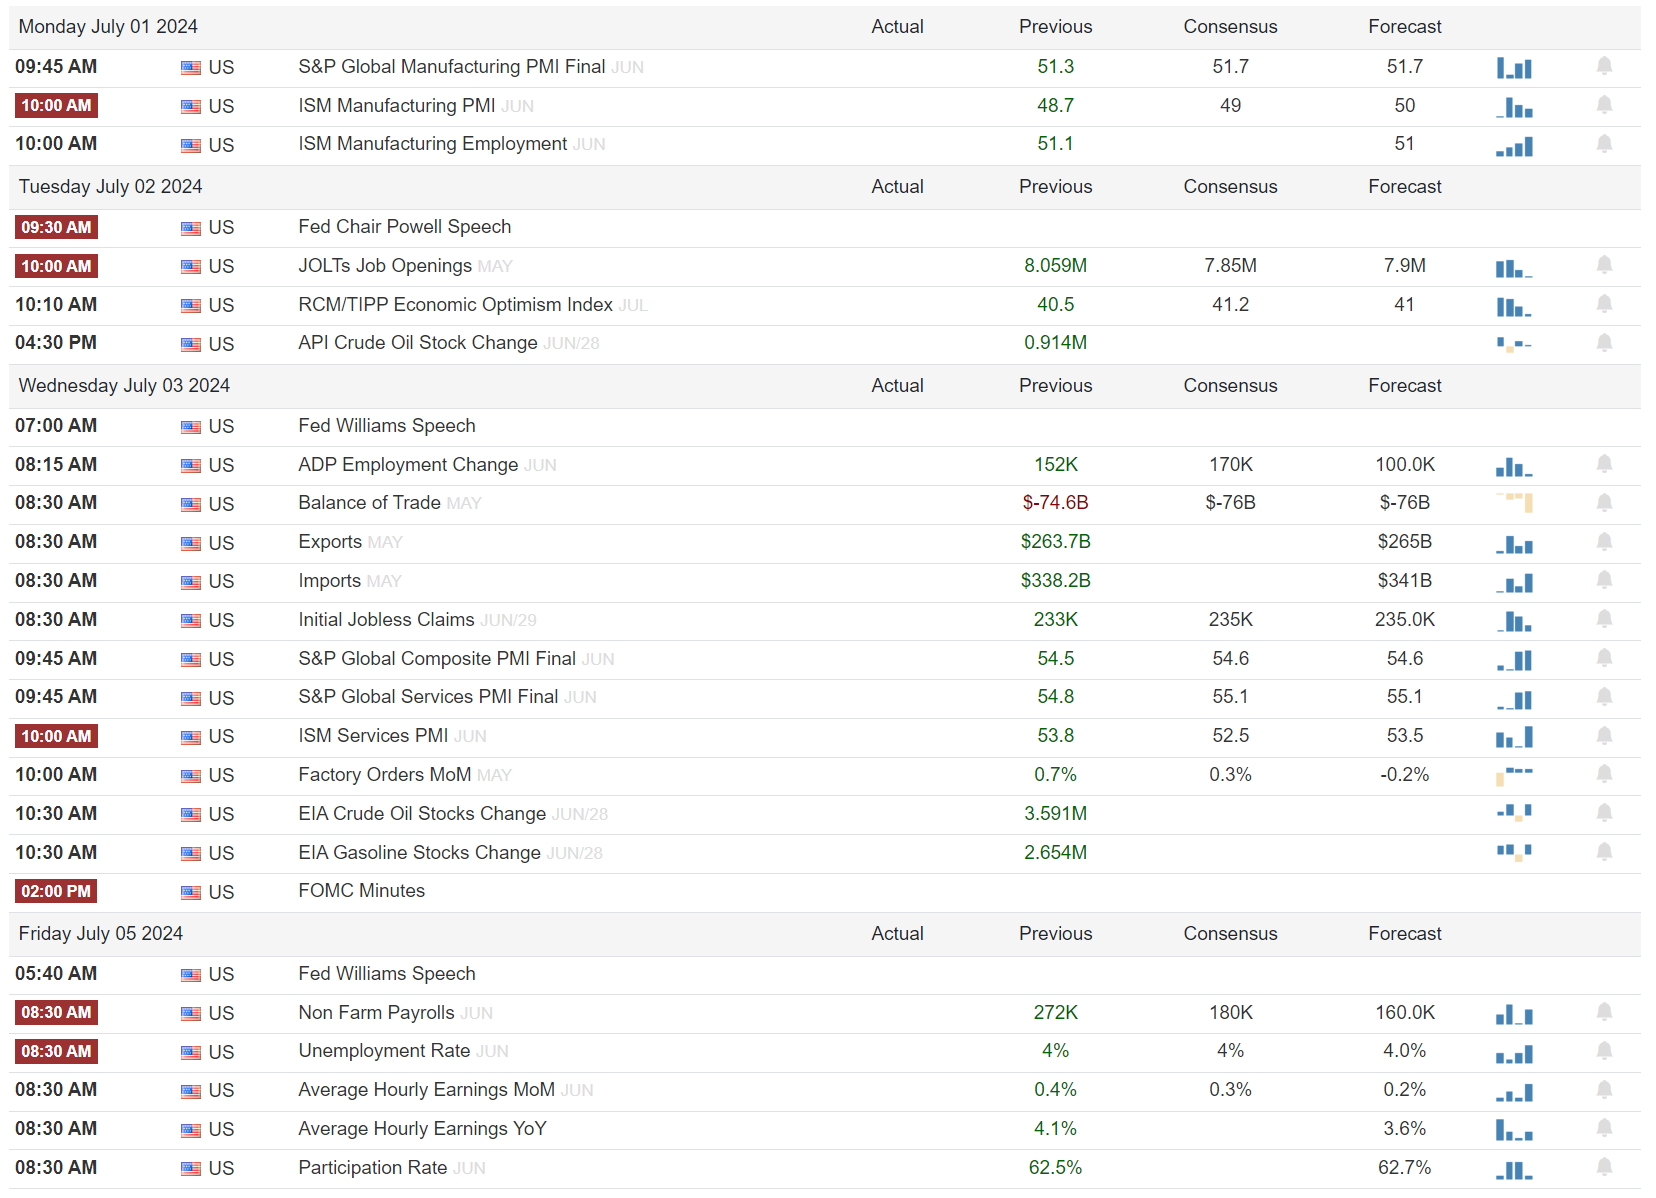
Econ Events On Deck This Week
Here are key economic events happening this week that have the potential to cause outsized moves in the market or heightened short-term volatility.
A Final Word
I’m providing a good deal of my time and a wealth of data from my proprietary platform to bring you actionable information every week at absolutely no cost to you. If you found even an ounce of useful information in here, I could really use your help: please share my stack with a friend, in your Discord or in a Tweet. It’s an insanely good deal that I hope to continue providing to you. Please checkout VolumeLeaders.com for your own free trial to all of the data powering this newsletter. Wishing you all a green week filled with bags.
---
Contact Info:
Web: https://www.volumeleaders.com
Twitter: https://twitter.com/volumeleaders
Youtube: https://youtube.com/@volumeleaders
Substack: https://volumeleaders.substack.com
Email: info@volumeleaders.com
This article is from an unpaid external contributor. It does not represent Benzinga's reporting and has not been edited for content or accuracy.
Edge Rankings
Price Trend
© 2025 Benzinga.com. Benzinga does not provide investment advice. All rights reserved.
Trade confidently with insights and alerts from analyst ratings, free reports and breaking news that affects the stocks you care about.

