


Originally published at VolumeLeaders
What to expect for July 29- August 02, 2024

Weekly Wrap-Up
During the week, U.S. markets experienced notable volatility, driven by geopolitical tensions, earnings reports, and economic data. While the Dow Jones Industrial Average DJIA saw gains, the S&P 500 and Nasdaq Composite faced declines due to pressures on tech stocks.
Key Drivers:
Earnings Reports:
- Strong earnings from companies like 3M Co. and Bristol-Myers Squibb helped lift investor sentiment.
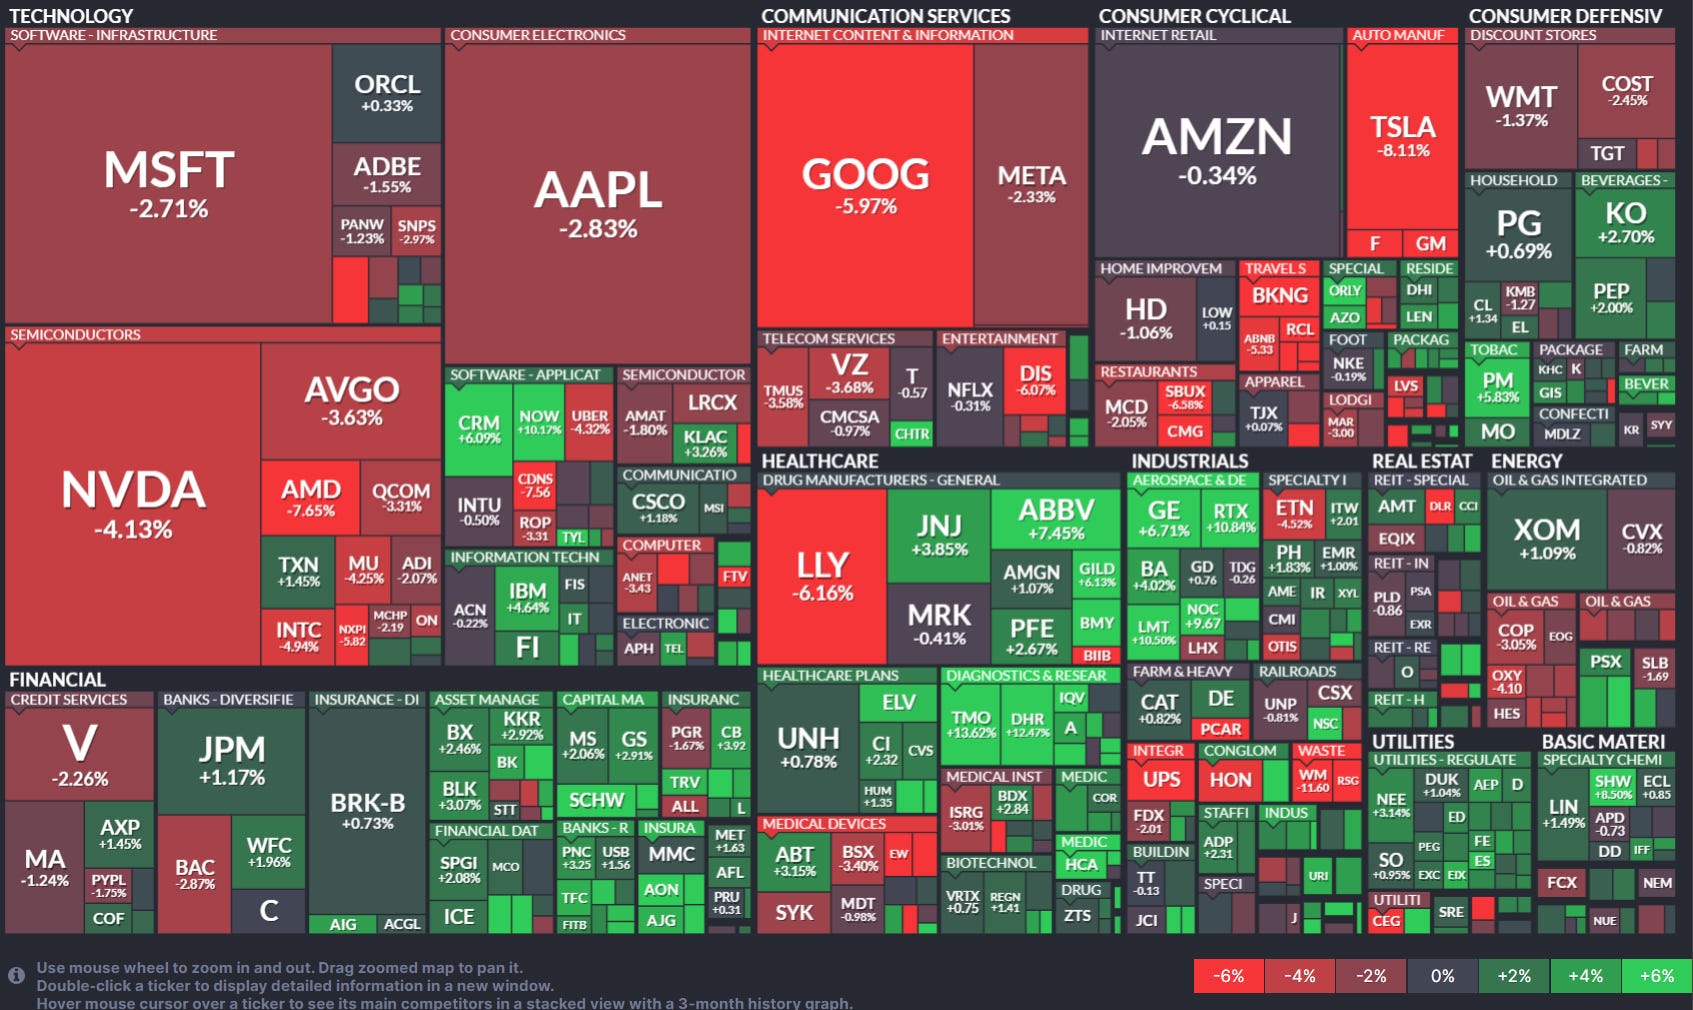
- Alphabet and Tesla's disappointing results contributed to midweek slumps, with the Nasdaq experiencing its largest drop since October 2022.
Economic Data:
- The Personal Consumption Expenditures (PCE) price index rose modestly, supporting expectations for a Federal Reserve rate cut.
- Lower-than-expected inflation figures added to the optimism about potential rate cuts, bolstering broader market confidence.
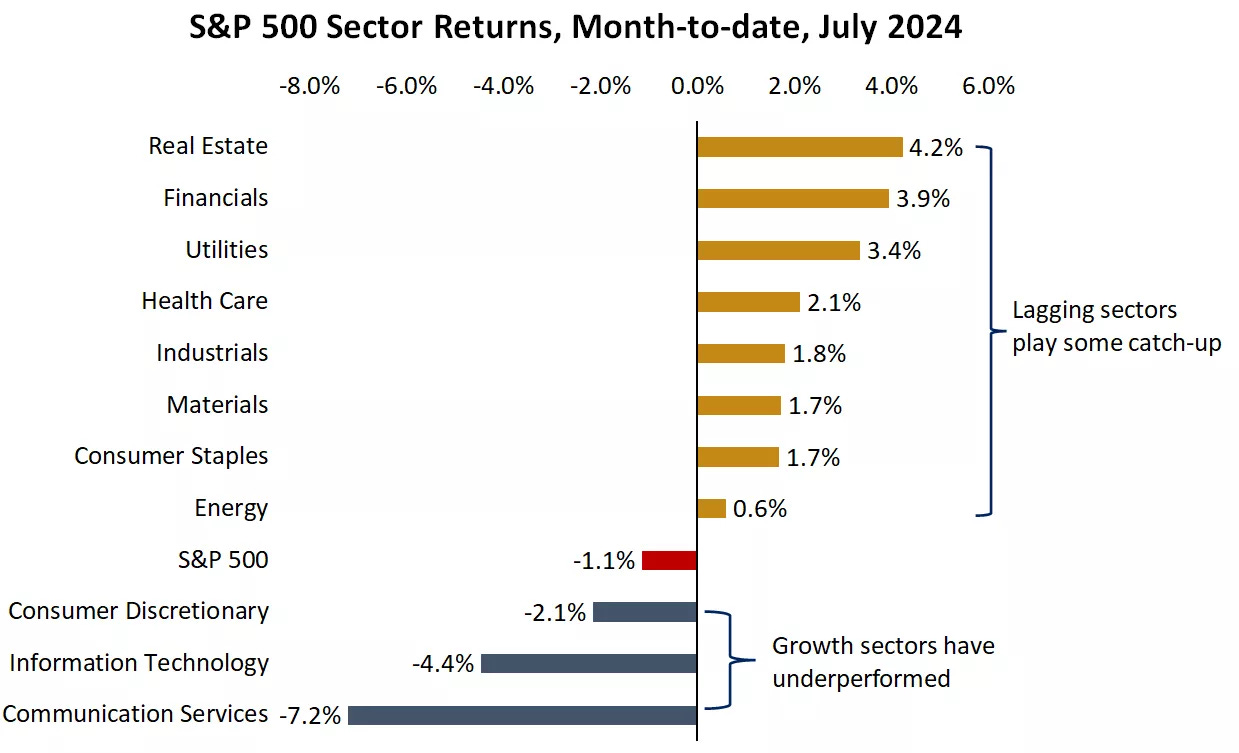
Sector Performance:
- Small-cap stocks and cyclical sectors outperformed, driven by rotation from high-valued tech stocks to other market areas.
- The "Magnificent 7" tech stocks faced a correction, reflecting a shift in investor focus.
Geopolitical Tensions: Heightened U.S.-China trade conflicts raised concerns over supply chain disruptions, impacting investor sentiment. These tensions added to the market's volatility, influencing trading patterns and investment decisions.
Economic Indicators:
- Inflation: The core PCE index's modest rise reinforced expectations of a potential Fed rate cut in September.
- Employment Data: The upcoming July payrolls report and Federal Reserve meeting are anticipated to be significant drivers of market movement in the following week.
Stocks on the Move:
- 3M Co. MMM: Surged 24% after exceeding earnings expectations and raising its full-year forecast.
- Aon AON: Jumped 7.7% on strong quarterly results.
- Bristol-Myers Squibb BMY: Rose over 11% due to positive earnings and a raised forecast.
- Coinbase Global COIN: Increased nearly 5%, benefiting from a rise in bitcoin prices.
- Colgate-Palmolive CL: Gained 3% following better-than-expected results and an improved yearly outlook.
- Dexcom DXCM: Dropped 41% after missing revenue estimates and lowering its forecast.
Crude Oil Prices: Oil prices fell nearly 4% to around $77 per barrel, marking the lowest level in about seven weeks amid expectations of sagging global demand.
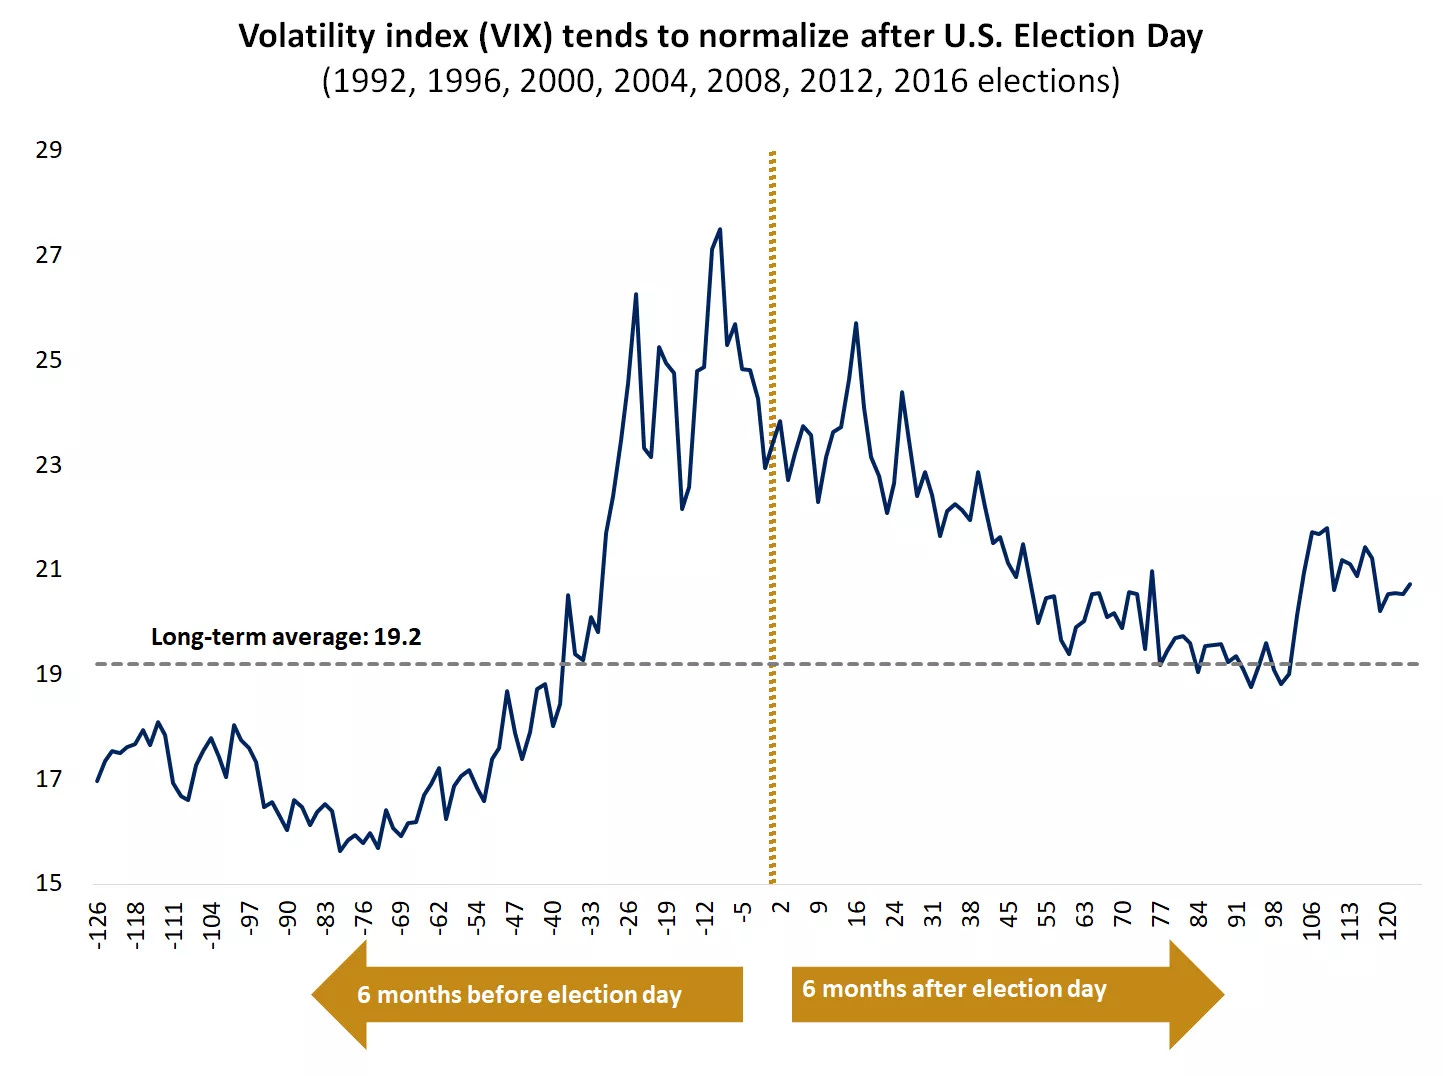
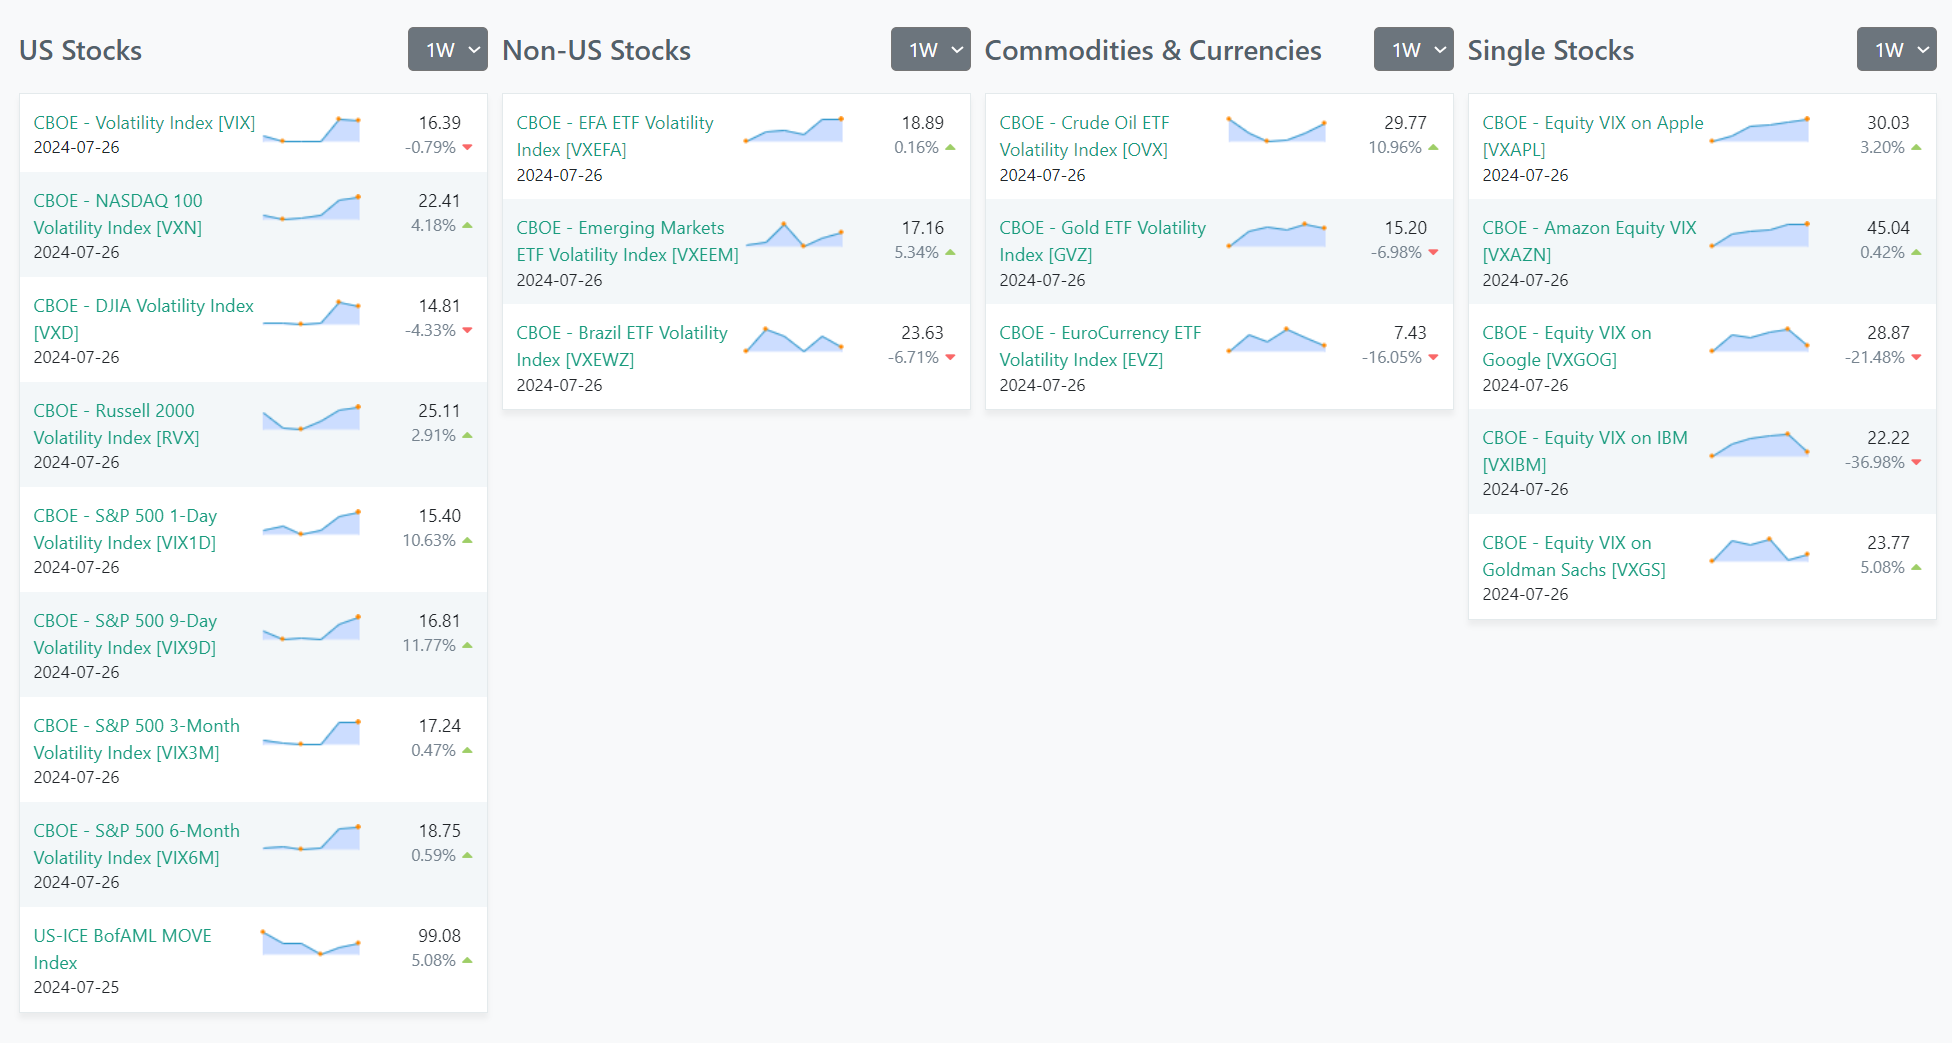
Volatility Index: The Cboe Volatility Index (VIX) saw a brief spike on Thursday, reaching levels 55% higher than its July 12 close before retreating by Friday, reflecting fluctuating investor sentiment.
International Market Performance:
- Europe: Mixed performance with Germany up 1.1% and Switzerland up 1.1%, while Japan fell 3.8%.
- Emerging Markets: Declines in Brazil (-2.0%), China (-2.3%), and Korea (-2.7%) contrasted with gains in India (1.8%).
Fixed Income Market:
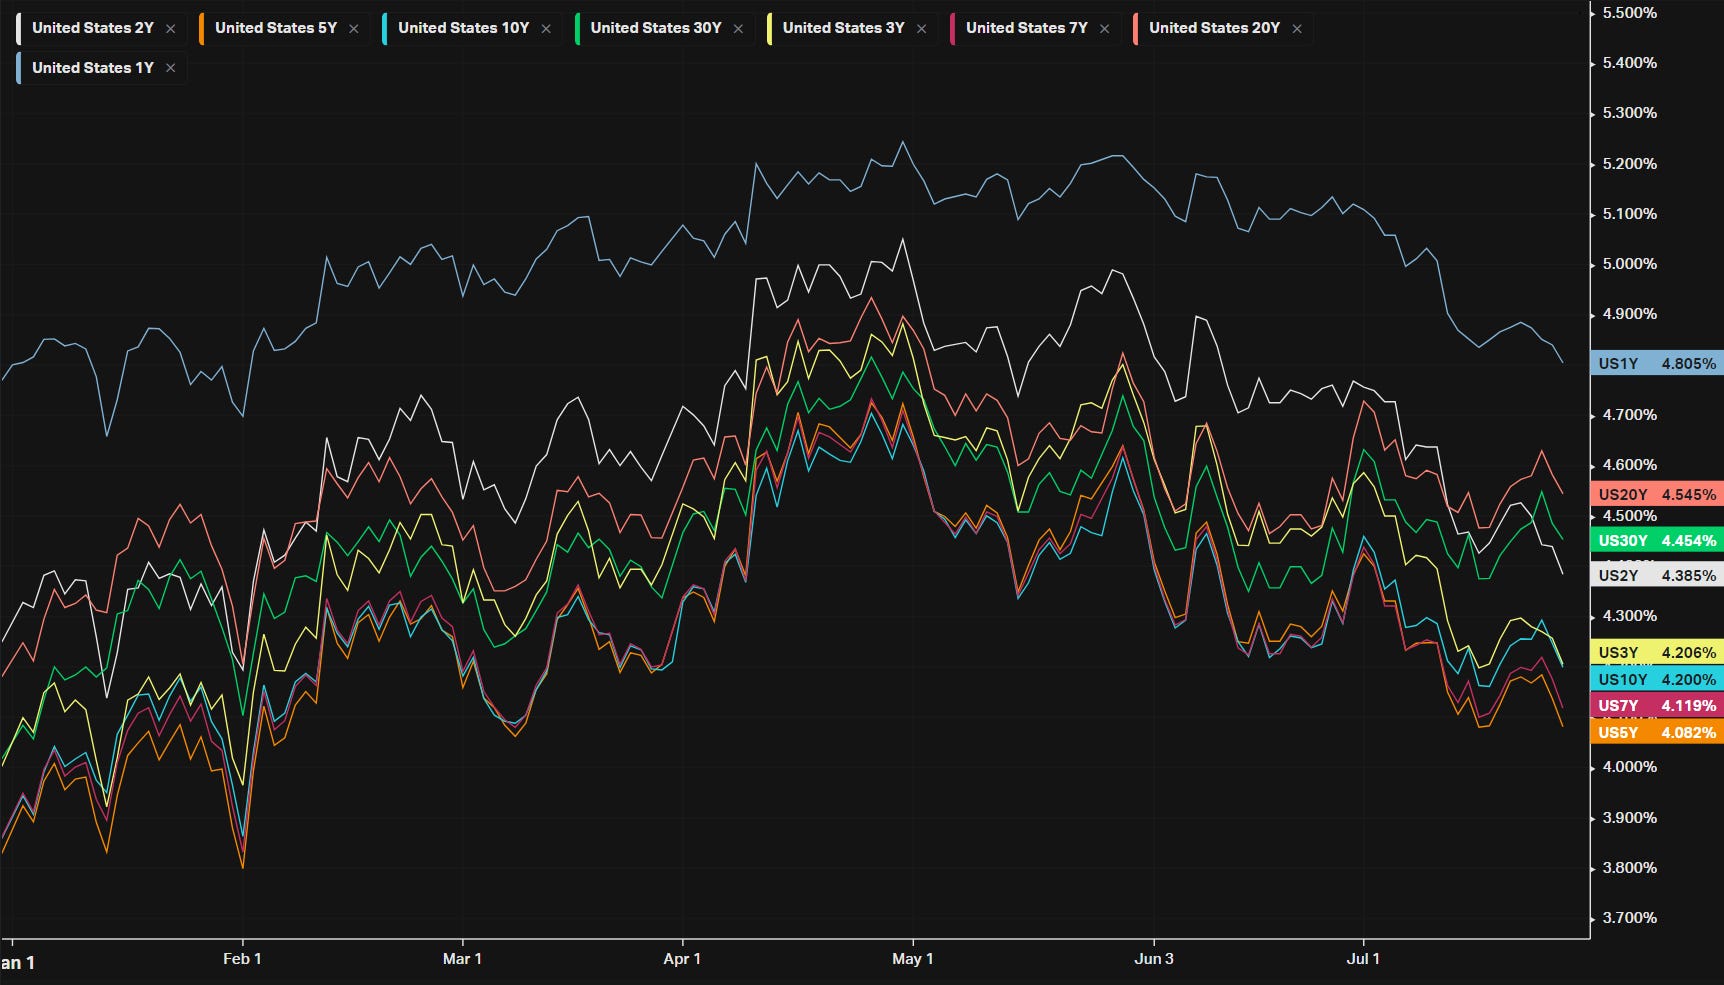
- U.S. Treasury Yields: The 10-year yield rose to 4.20%, up 32 basis points YTD.
- Corporate Bonds: High-yield bonds saw modest gains, while municipal bonds remained stable.
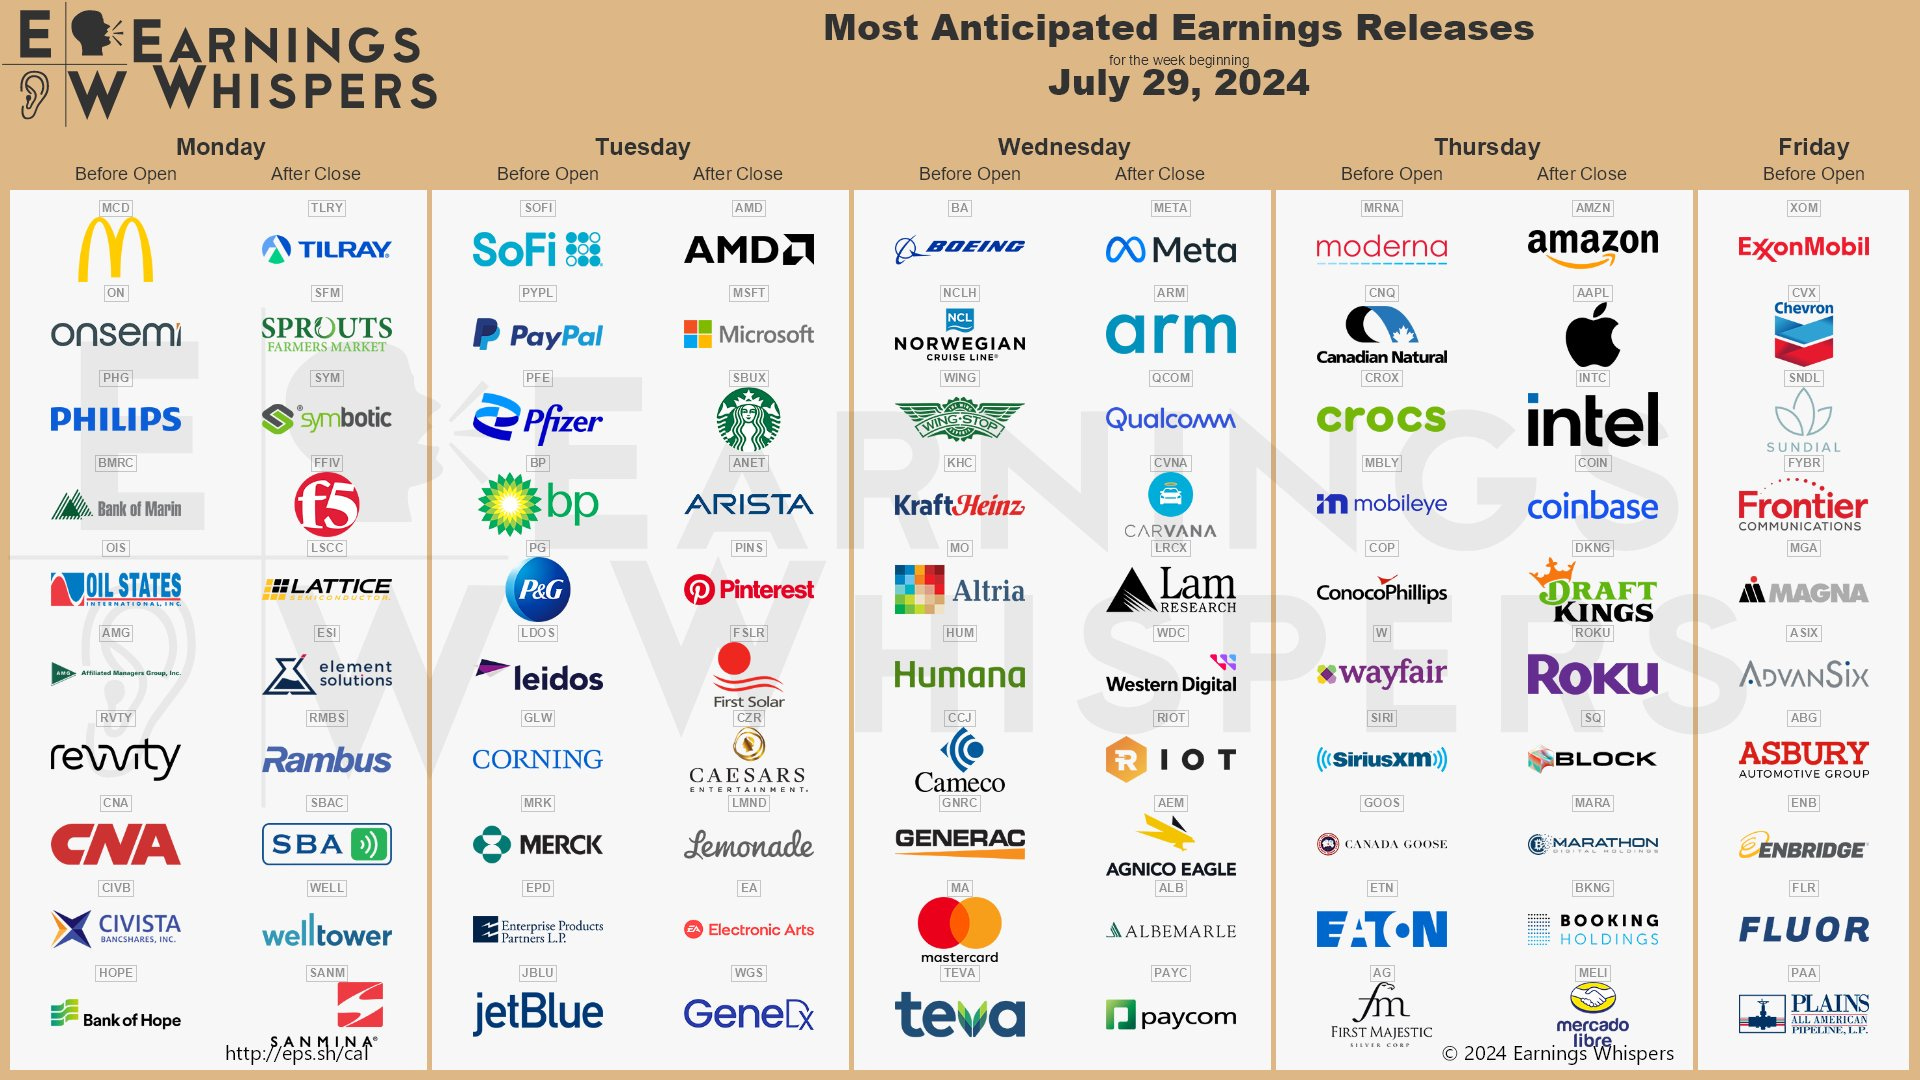
Looking Ahead: Investors are preparing for significant upcoming events, including earnings reports from major companies like McDonald's, Microsoft, Apple, Amazon, and Intel. Additionally, the Federal Reserve meeting and the July payrolls report are expected to provide further direction for market movements.
Volatility Snapshot For The Past Week
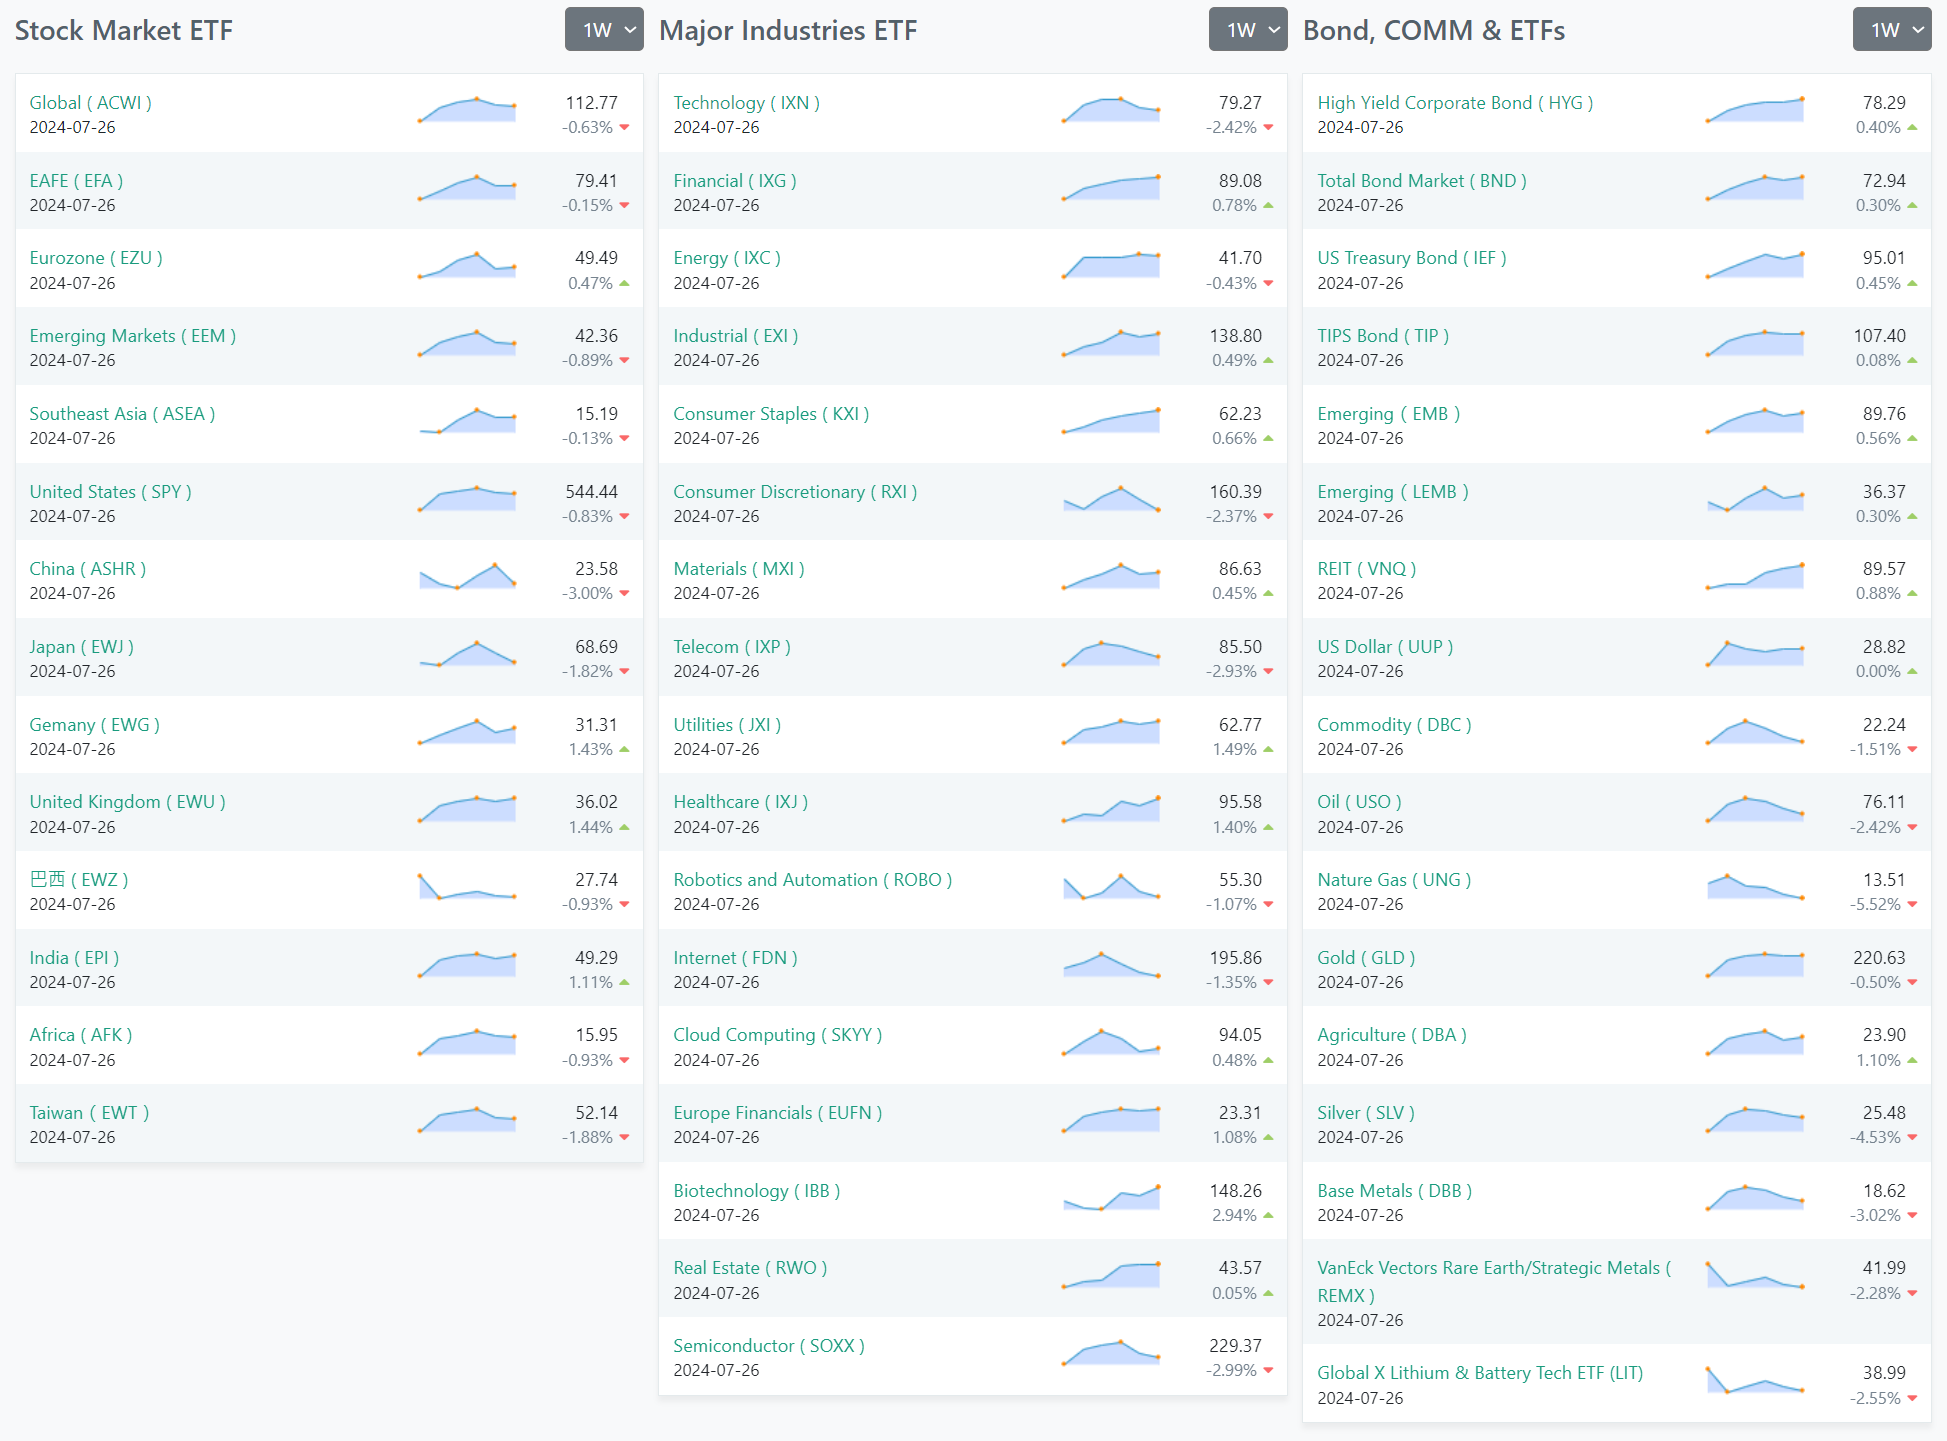
ETF Snapshot For The Past Week
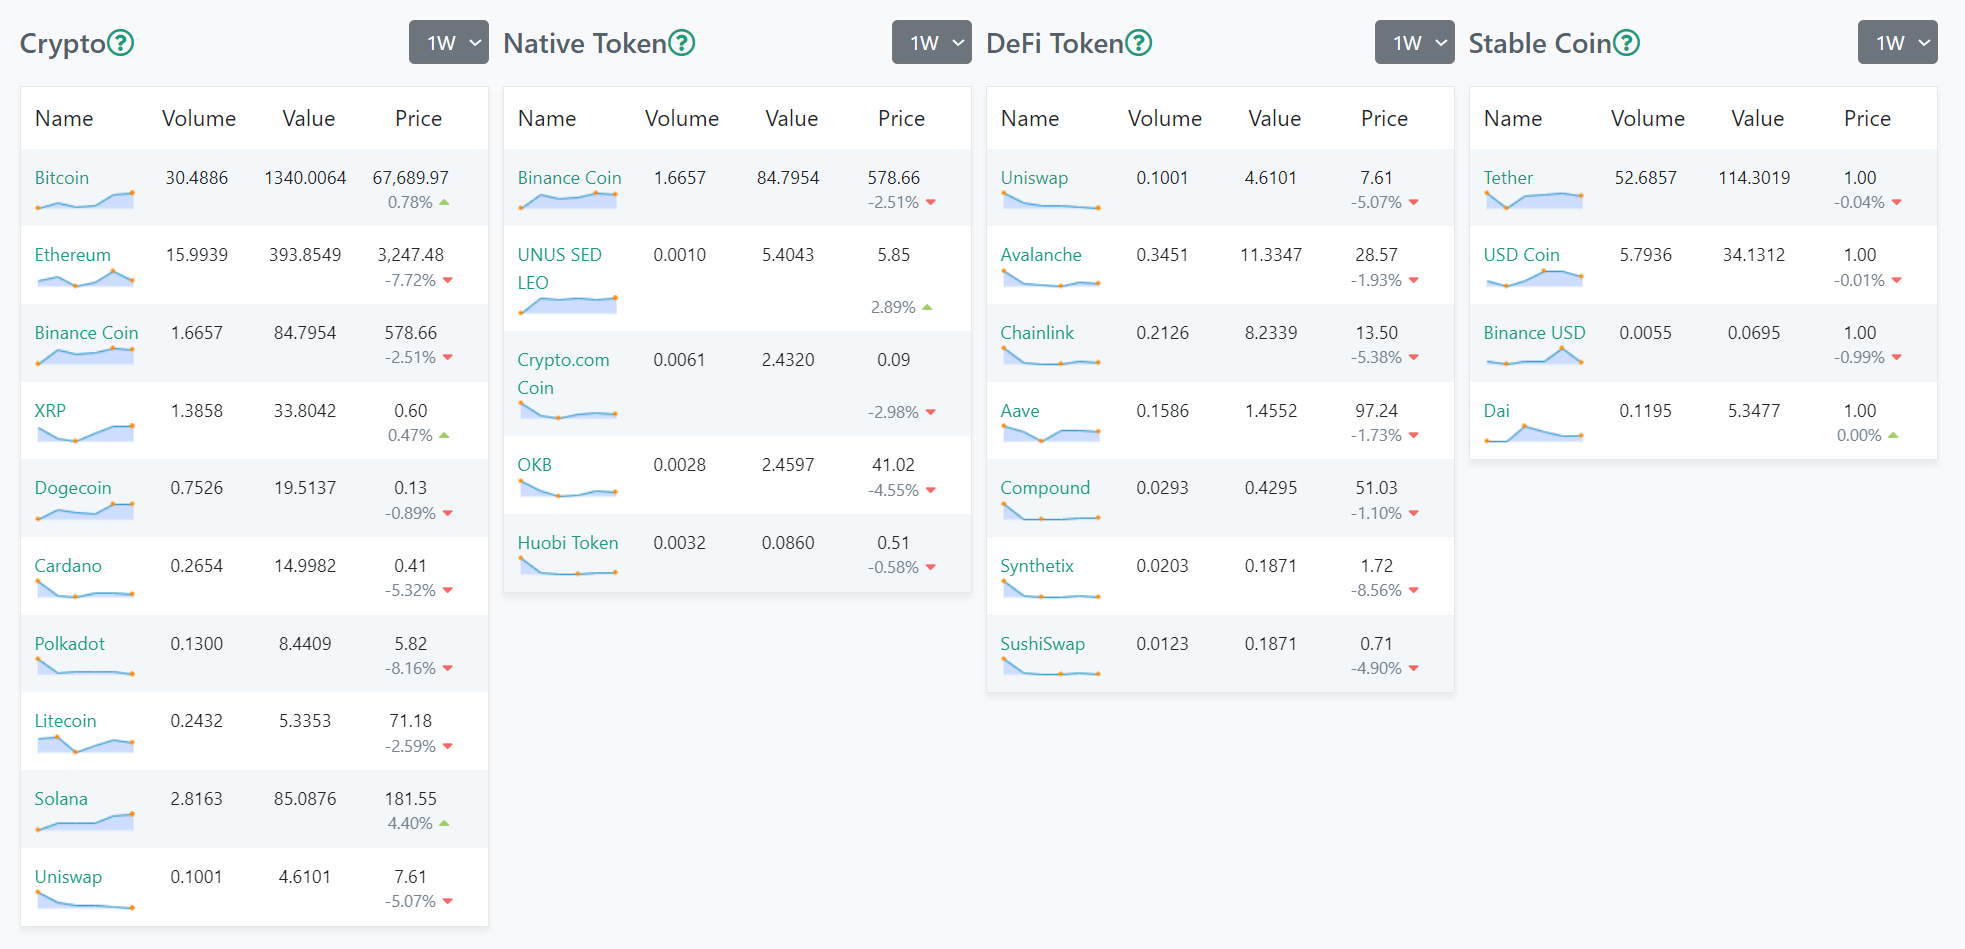
Crypto Snapshot For The Past Week
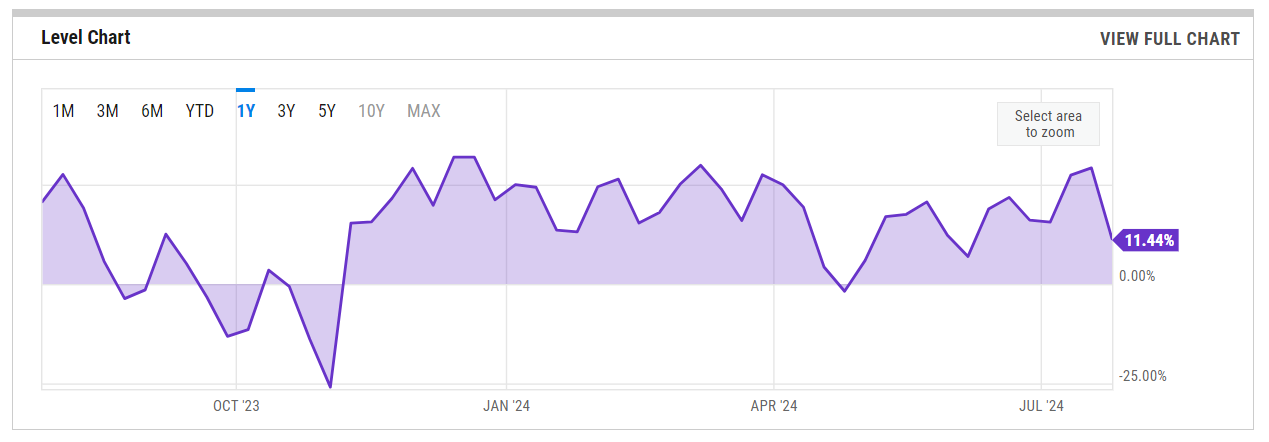
US Investor Sentiment / %Bull-Bear Spread
Absolutely crushed from a red-hot 29.3% last week, bull-mania seemingly tempered but still warmer than long-term average of 6.6%
NAAIM Exposure Index
Rapid adjustments from active risk managers also reflected in recent NAAIM readings.
Institutional S/R Levels For Major Indices
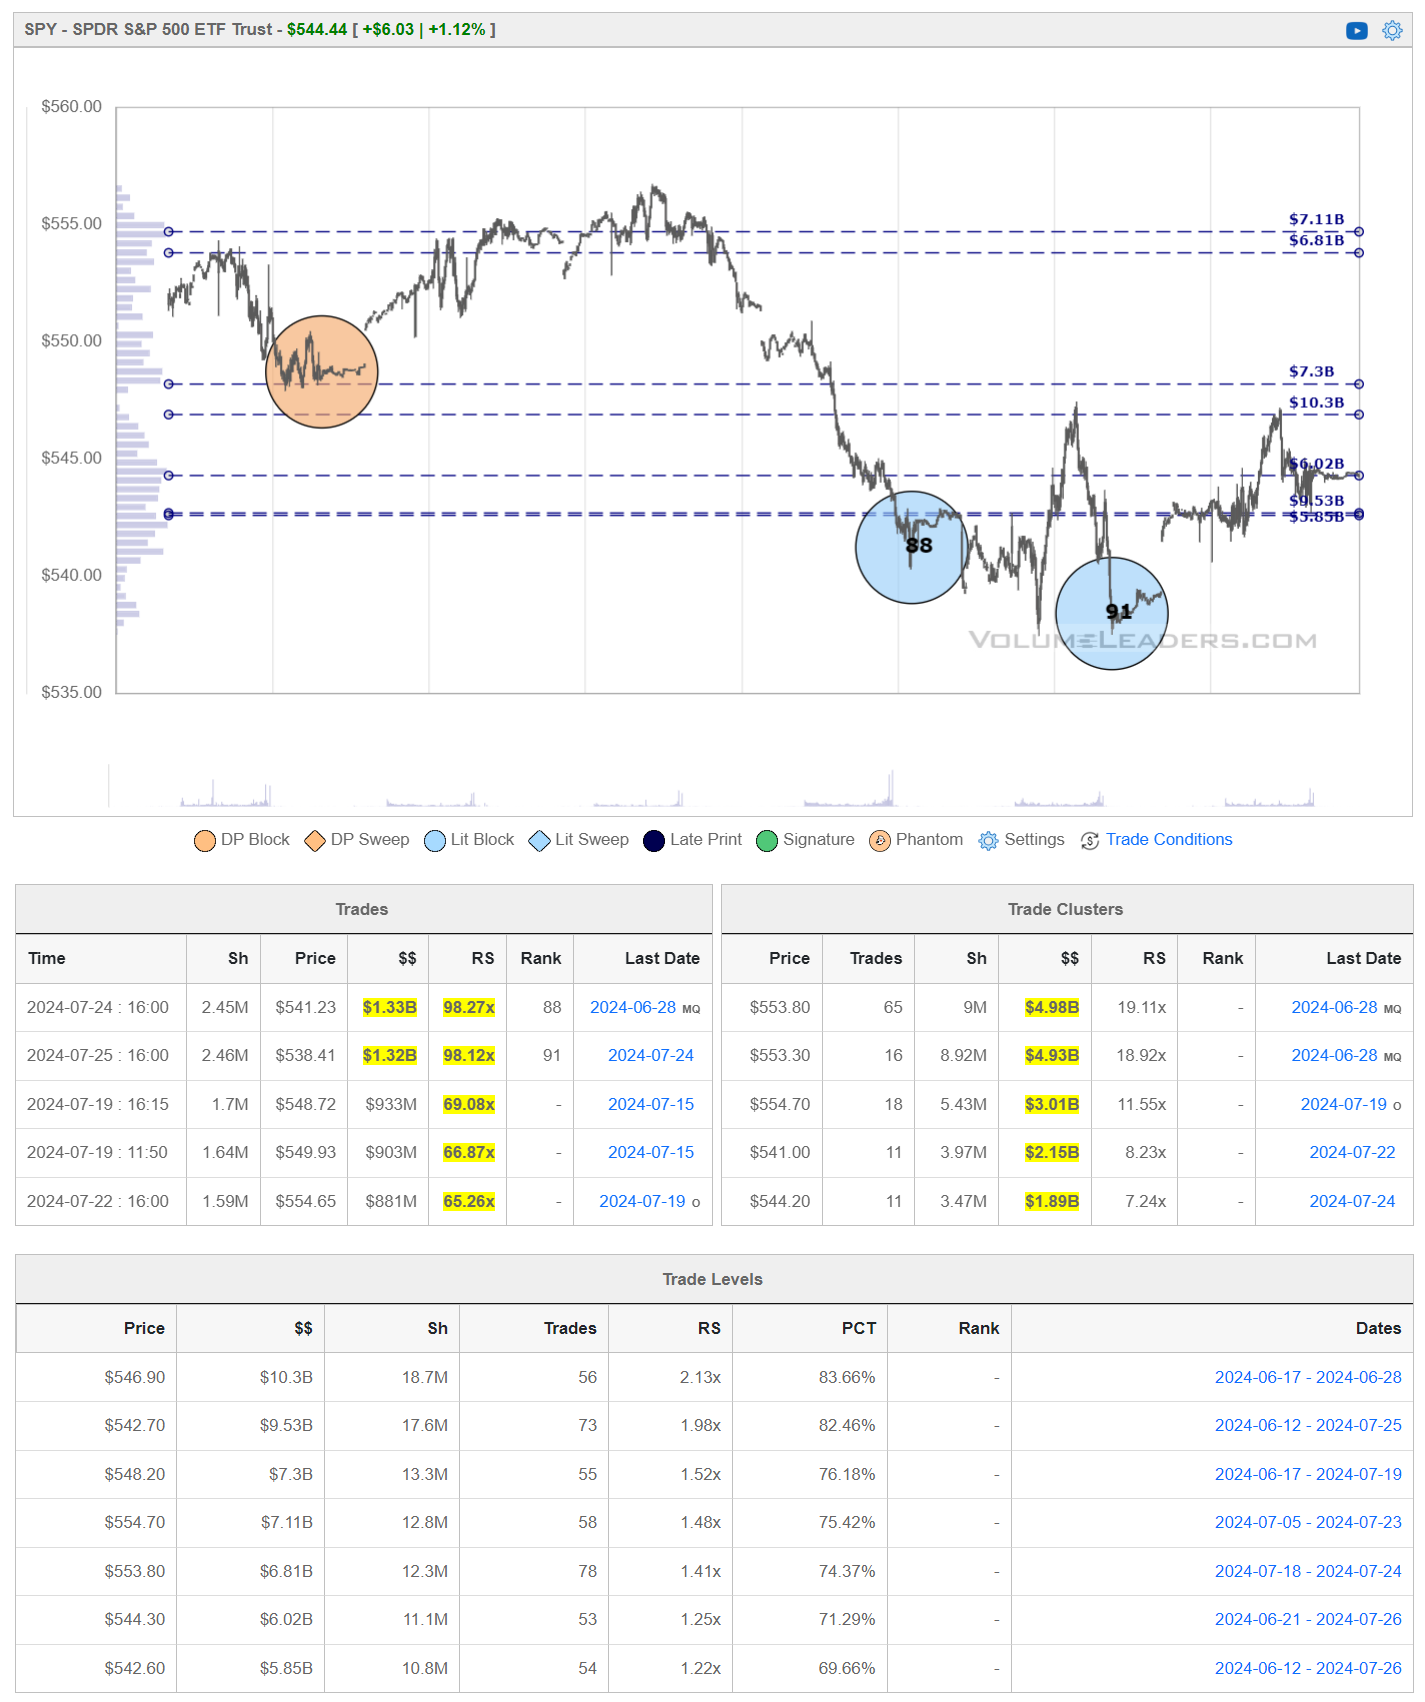
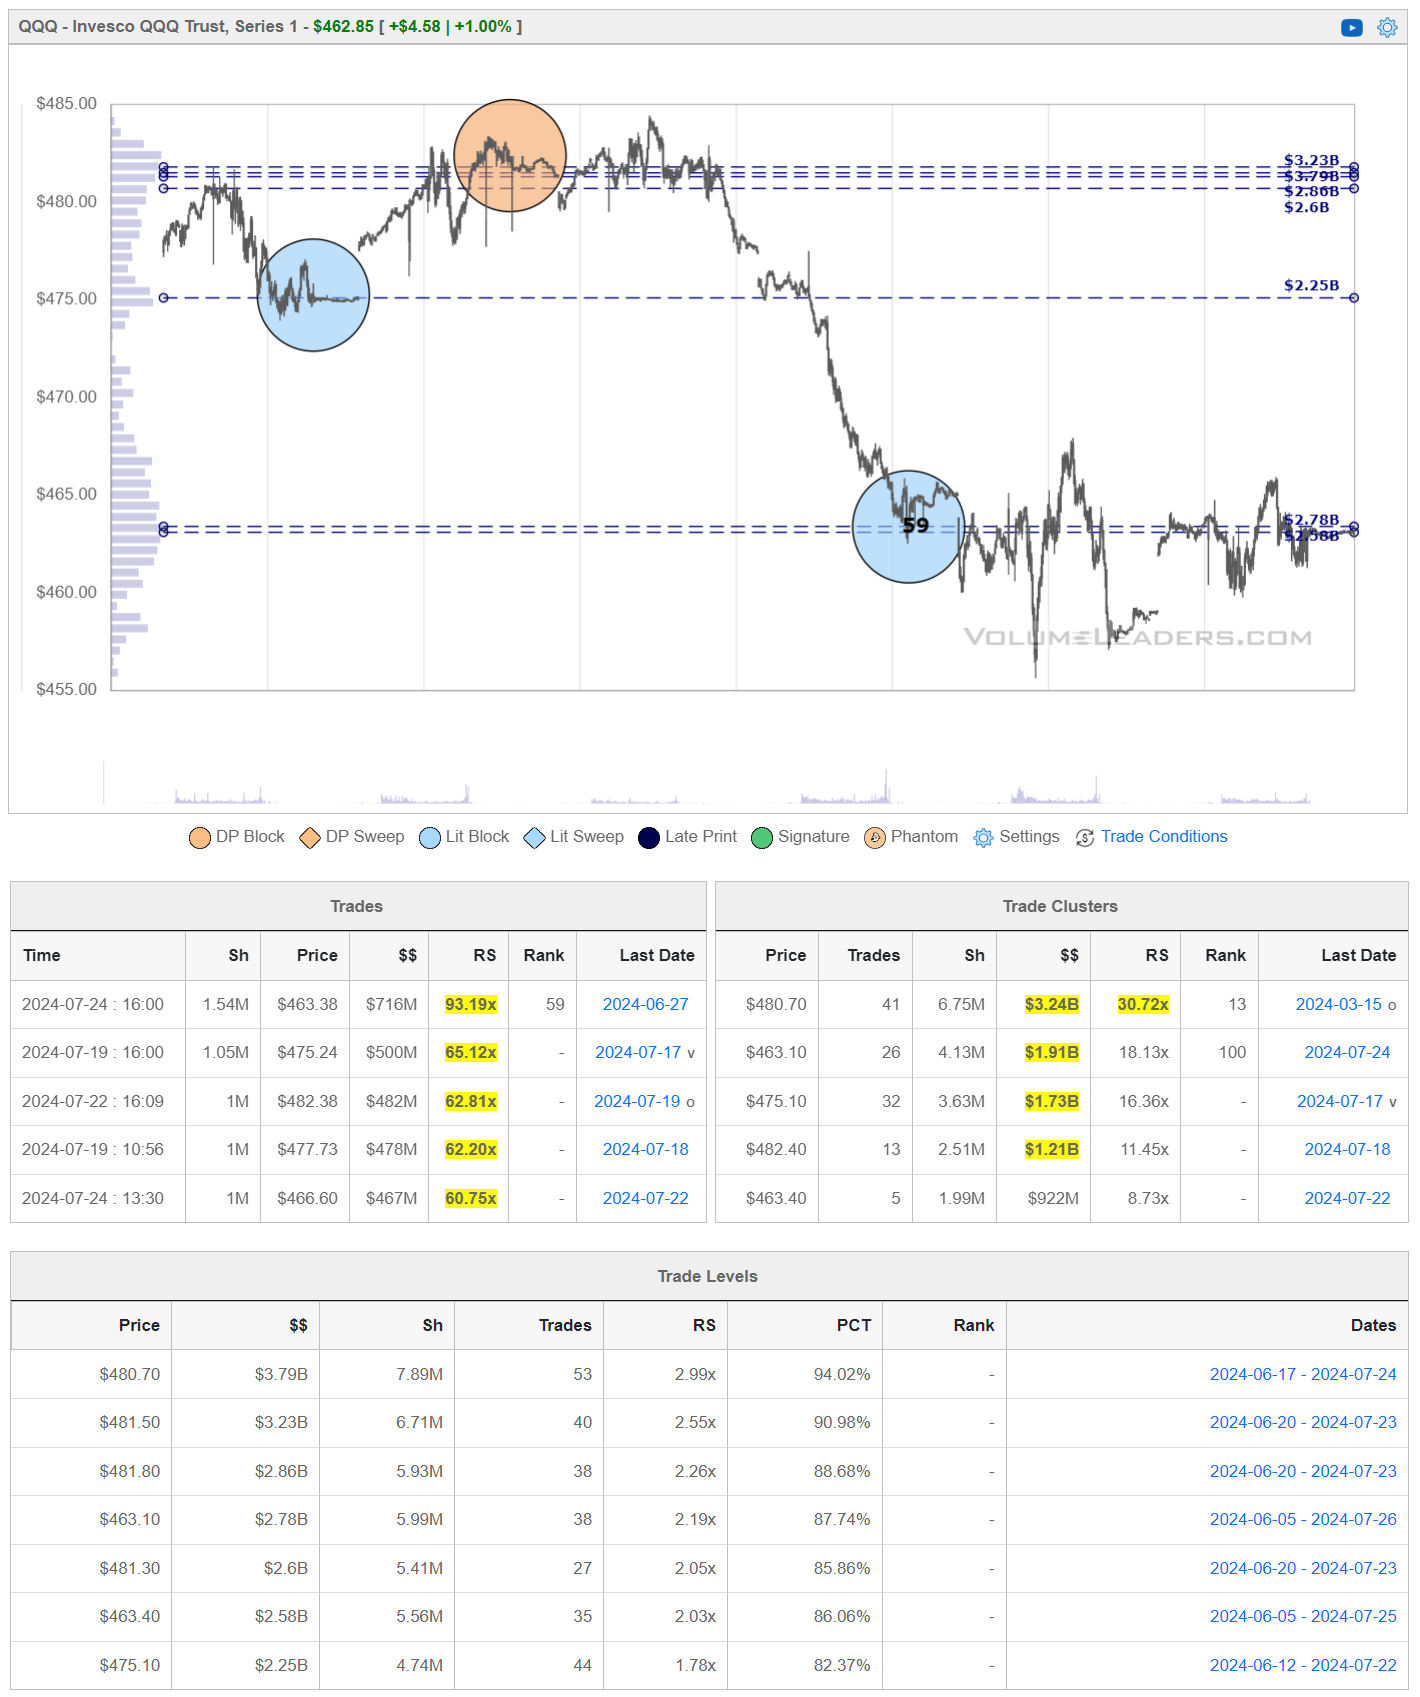
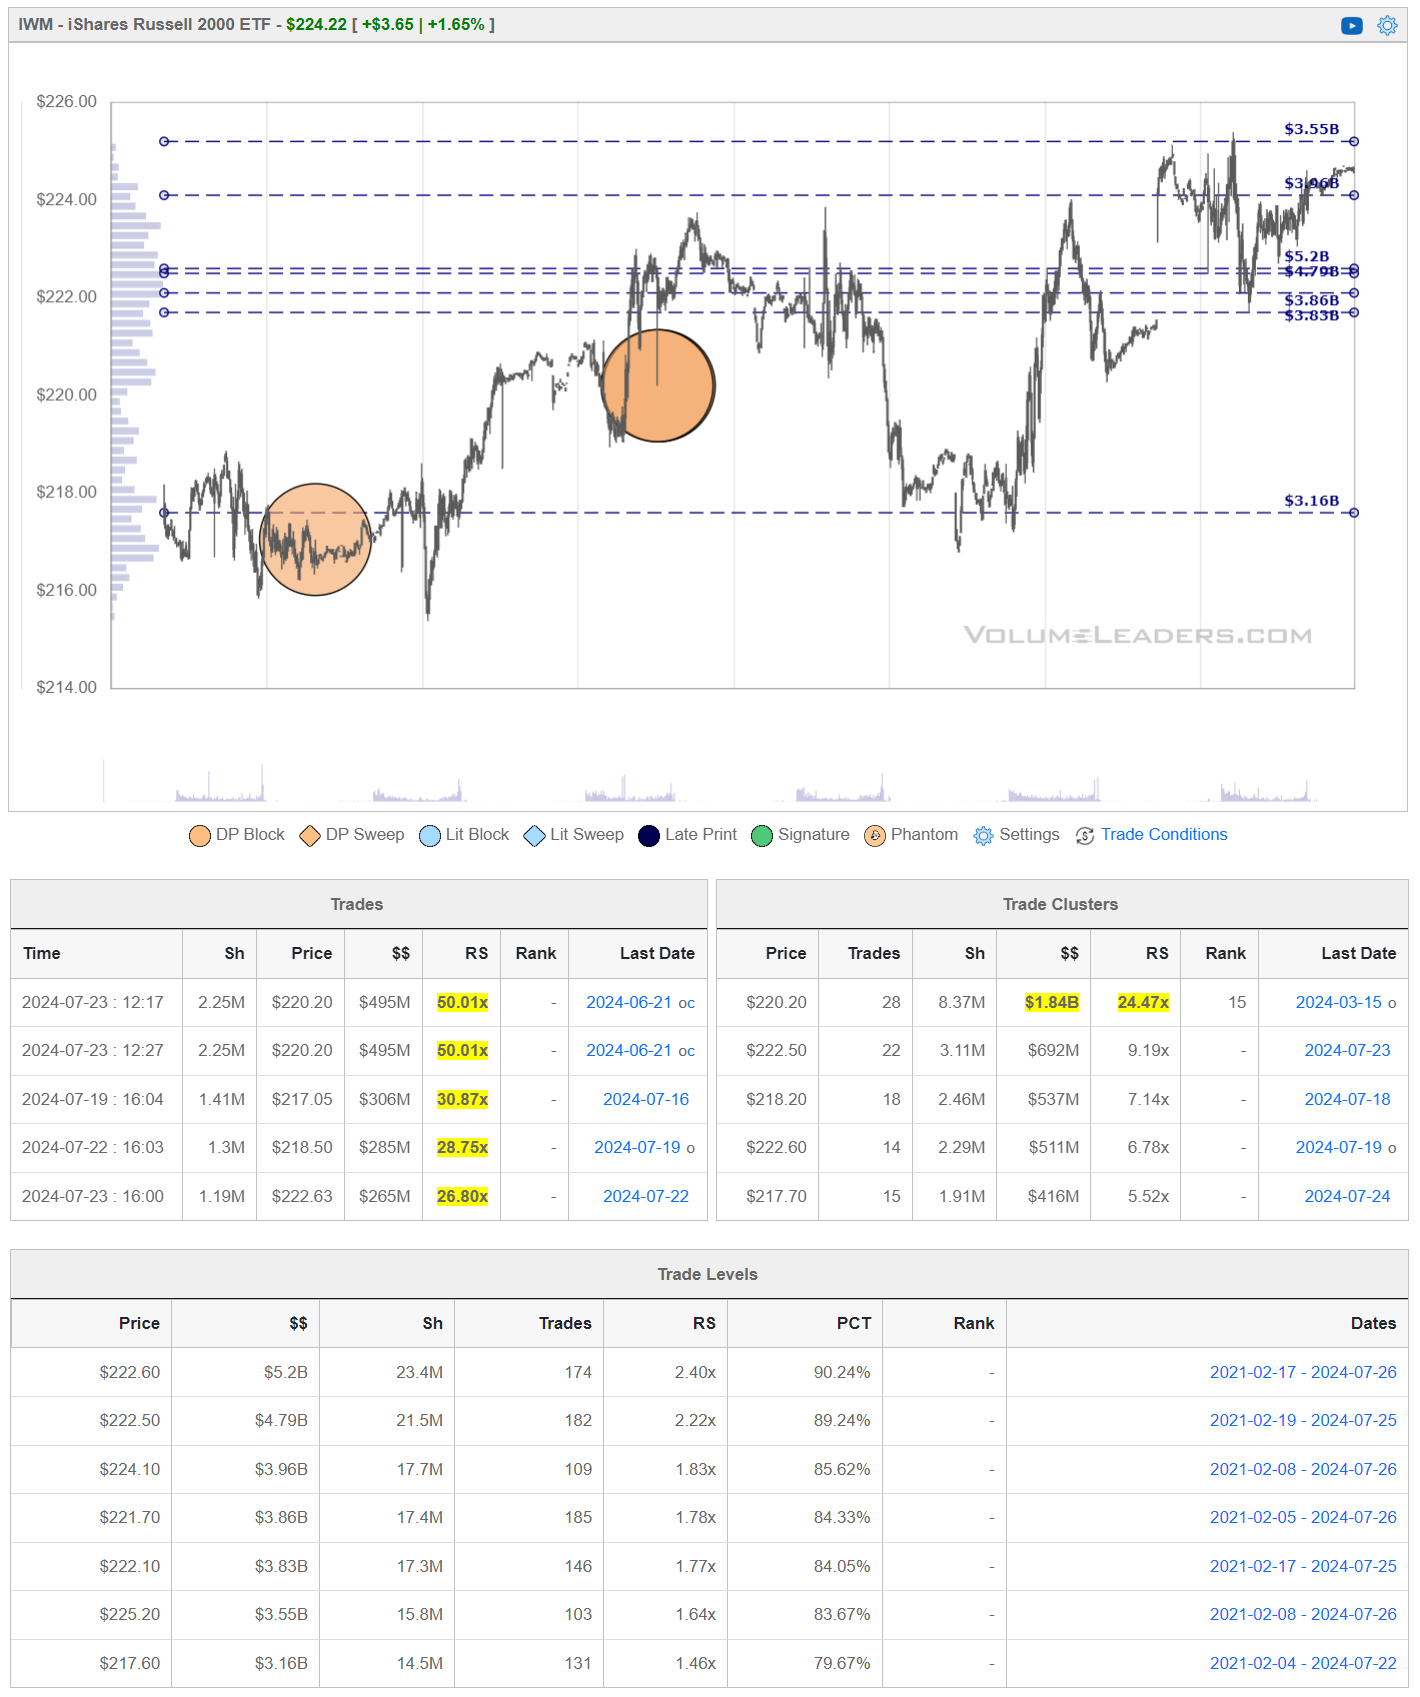
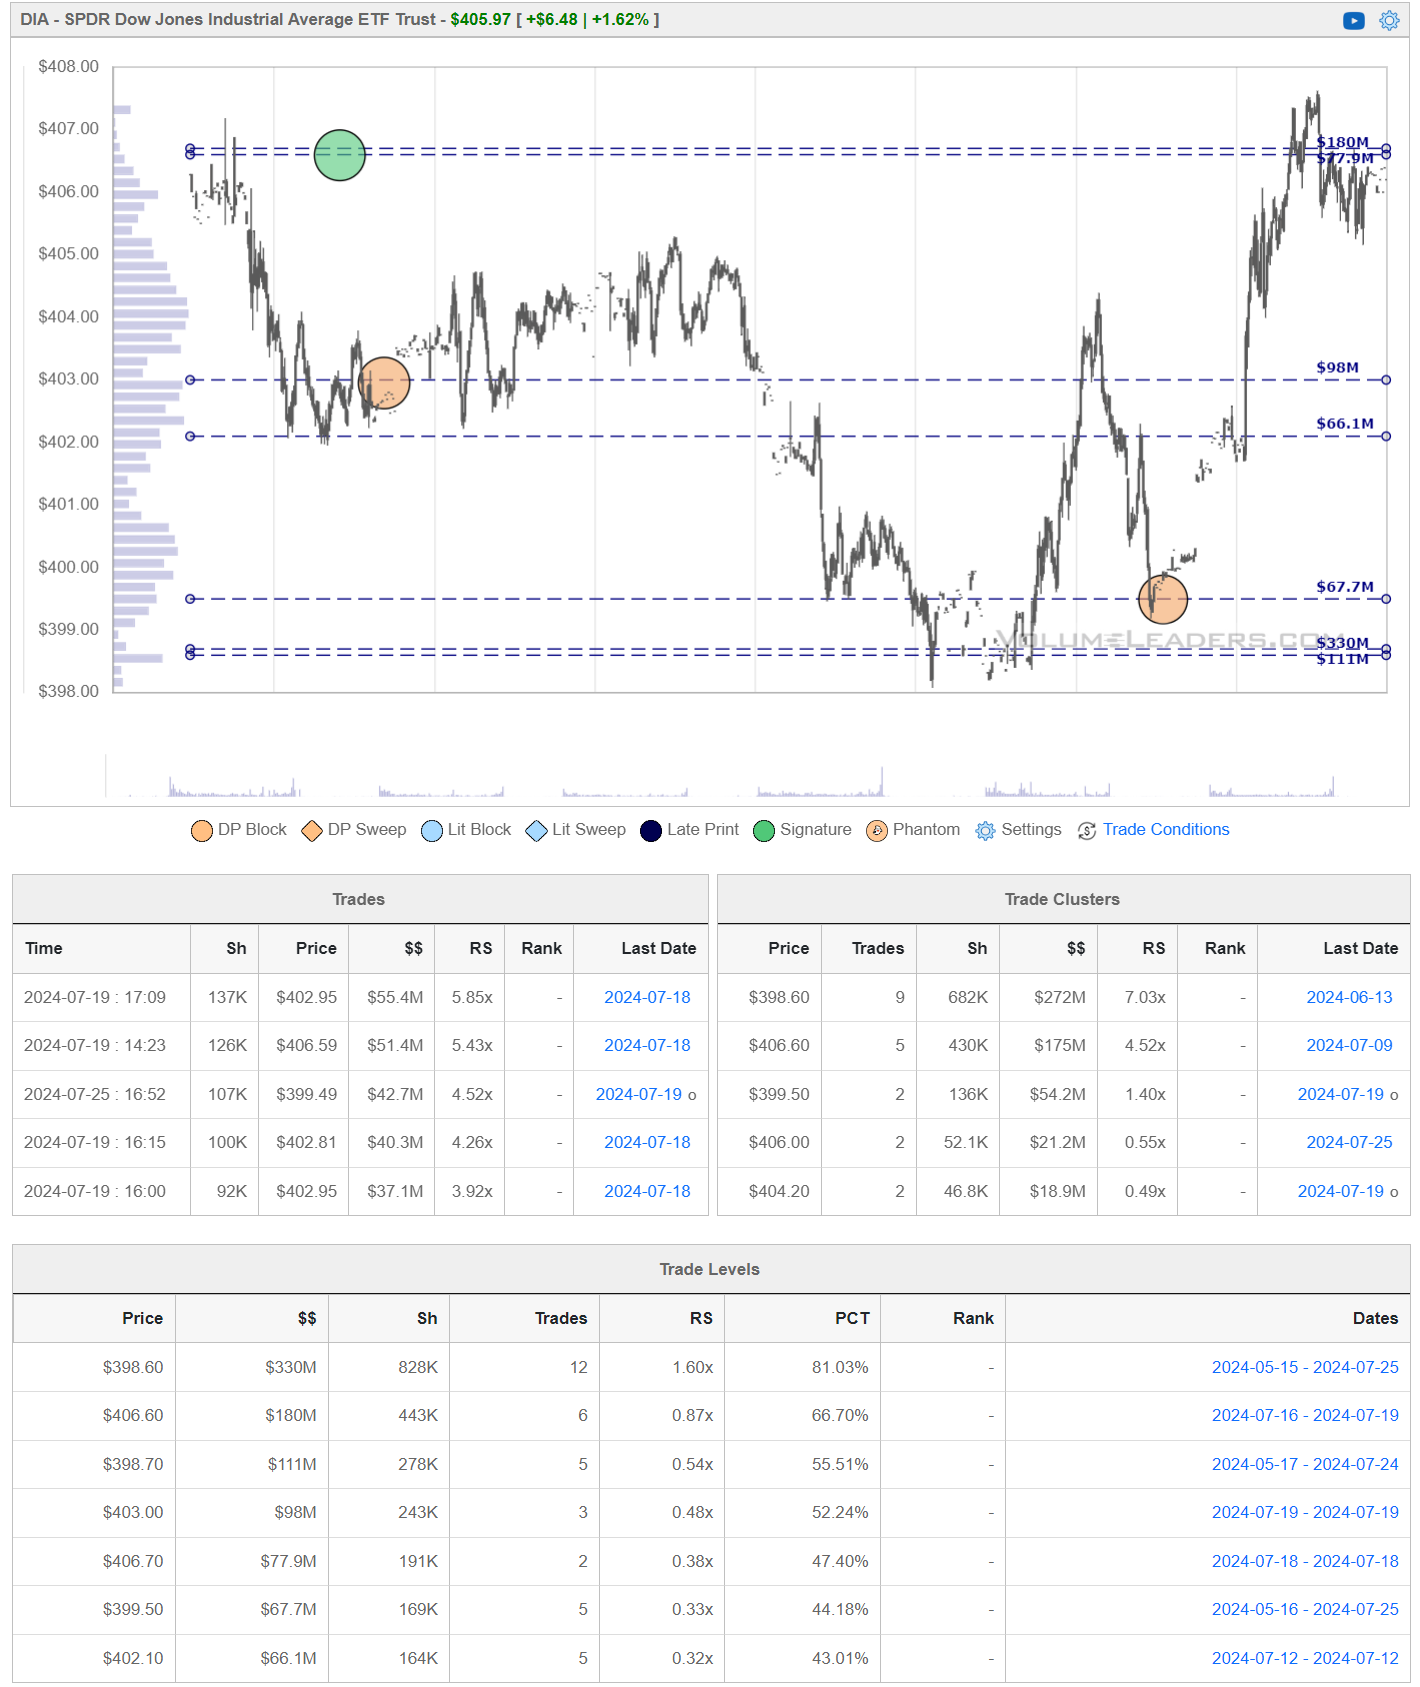
When you’re a large institutional player, your primary goal is to find liquidity - places to do a ton of business with the least amount of slippage possible. VolumeLeaders.com automatically identifies and visually plots the exact spots where institutions are doing business and where they are are likely to return for more. It’s one of the primary reasons “support” and “resistance” concepts work and truly one of the reasons “price has memory”.
Levels from the VolumeLeaders.com platform can help you formulate trades theses about:
- Where to add or take profit
- Where to de-risk or hedge
- What strikes to target for options
- Where to expect support or resistance
This is just a small sample; there are countless ways to leverage this information into trades that express your views on the market. The platform covers thousands of tickers on multiple timeframes to accommodate all types of traders. Observe for yourself how accurate the levels are by marking-up your charts with the information in the “Trade Levels” boxes I’m giving for free below and play-along in real-time this week. These charts cover the past 7 or so sessions but subs will get new levels as they develop in real-time and have access to levels from other time frames. I’m confident you’ll see how clear-cut, intuitive and actionable this information is for yourself.
SPY
QQQ
IWM
DIA
Get these levels in your inbox every week before the market opens, subscribe now
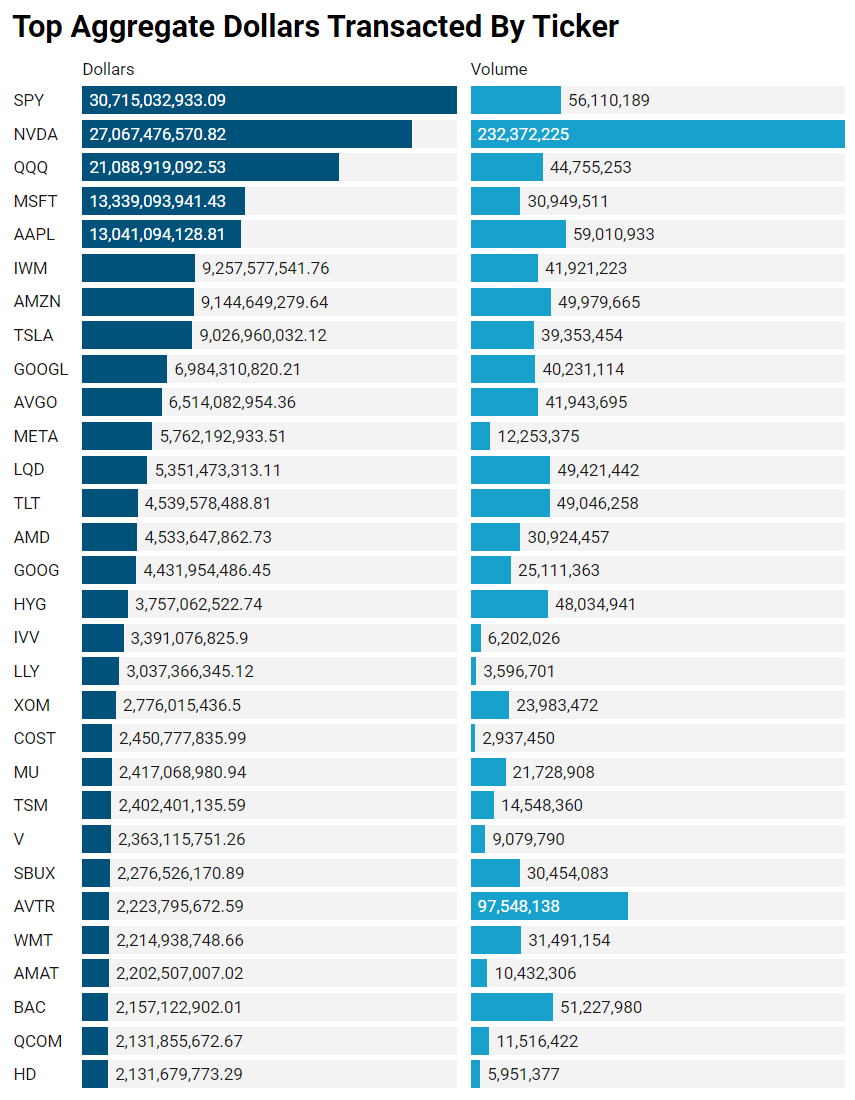
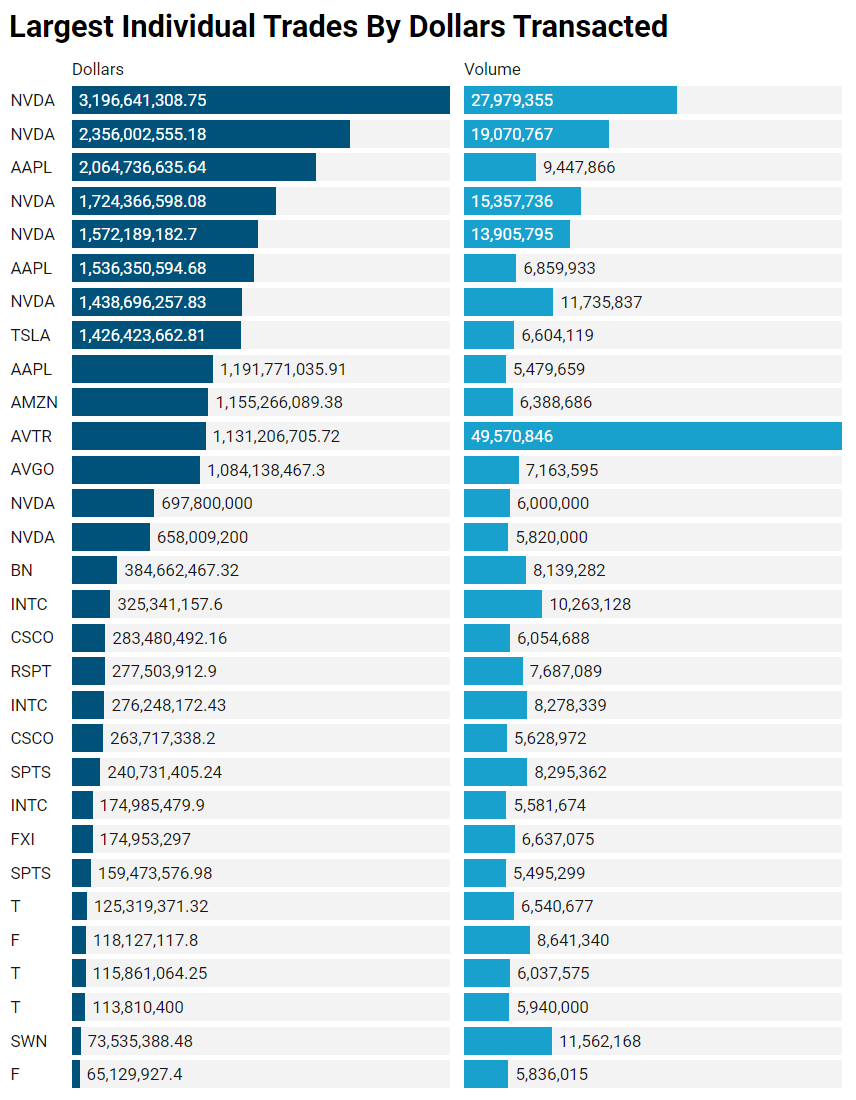
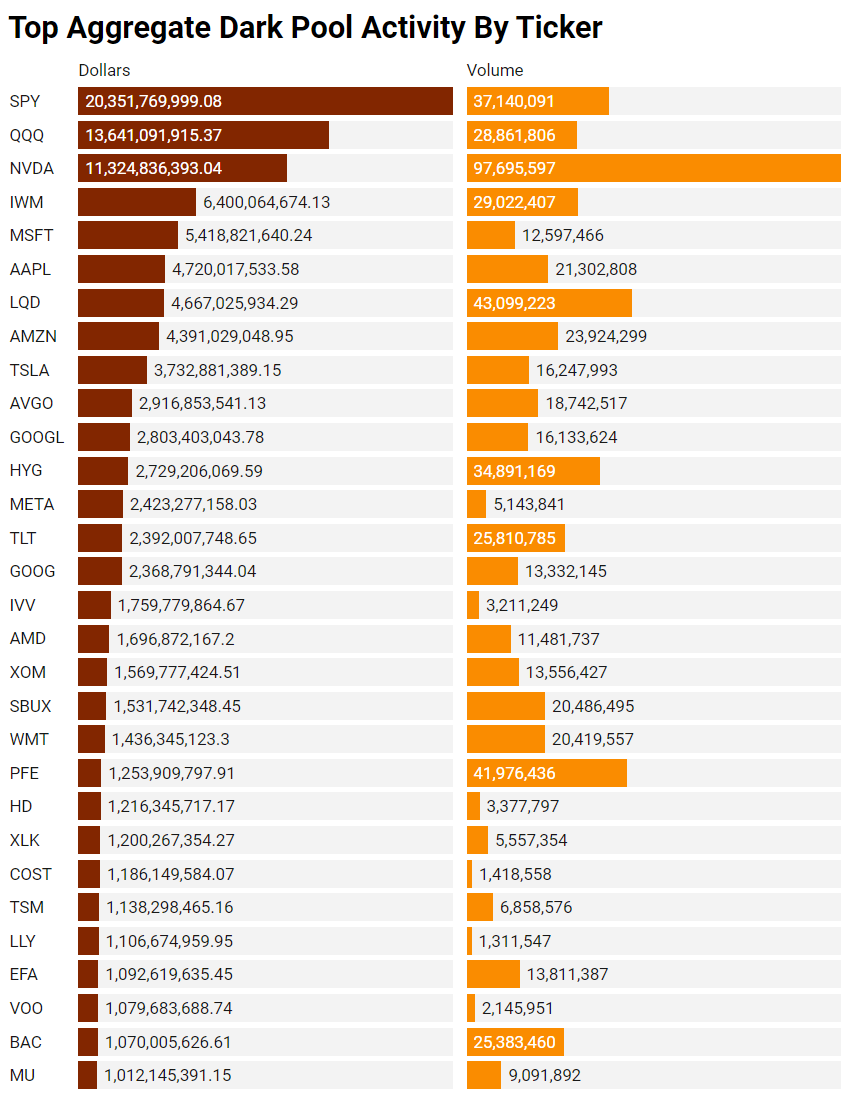
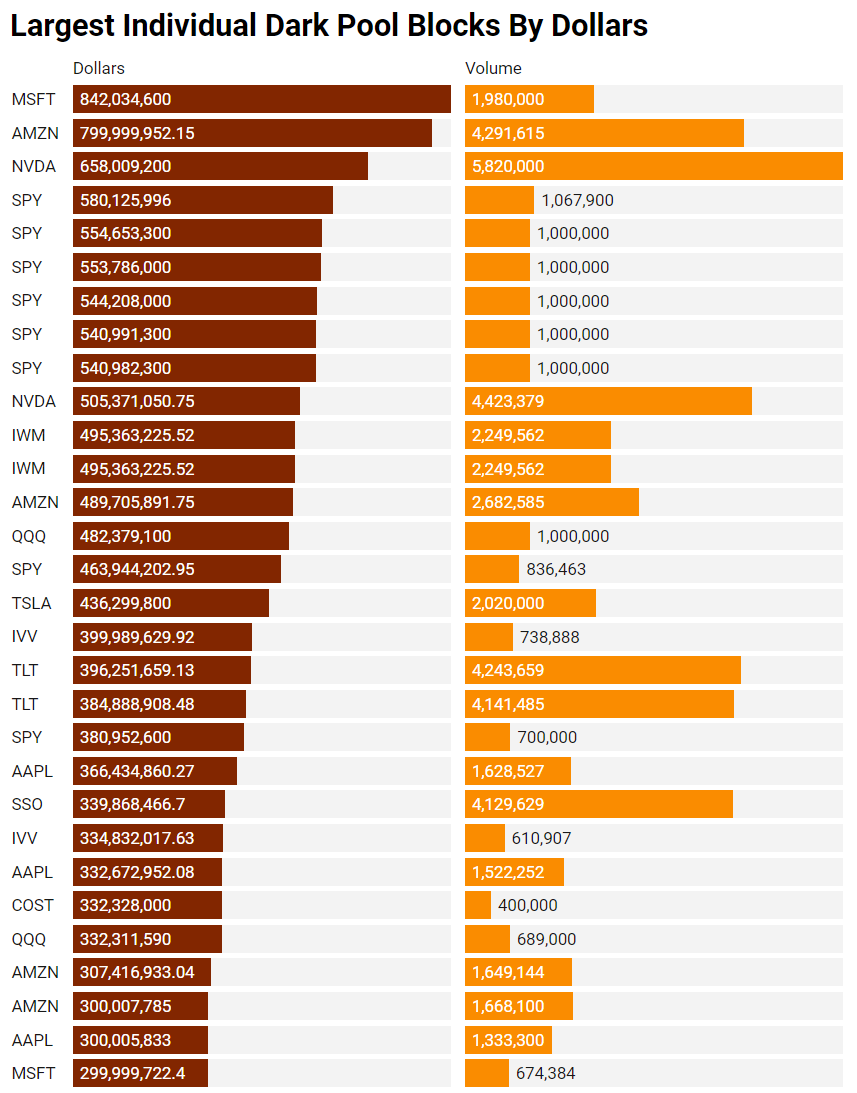
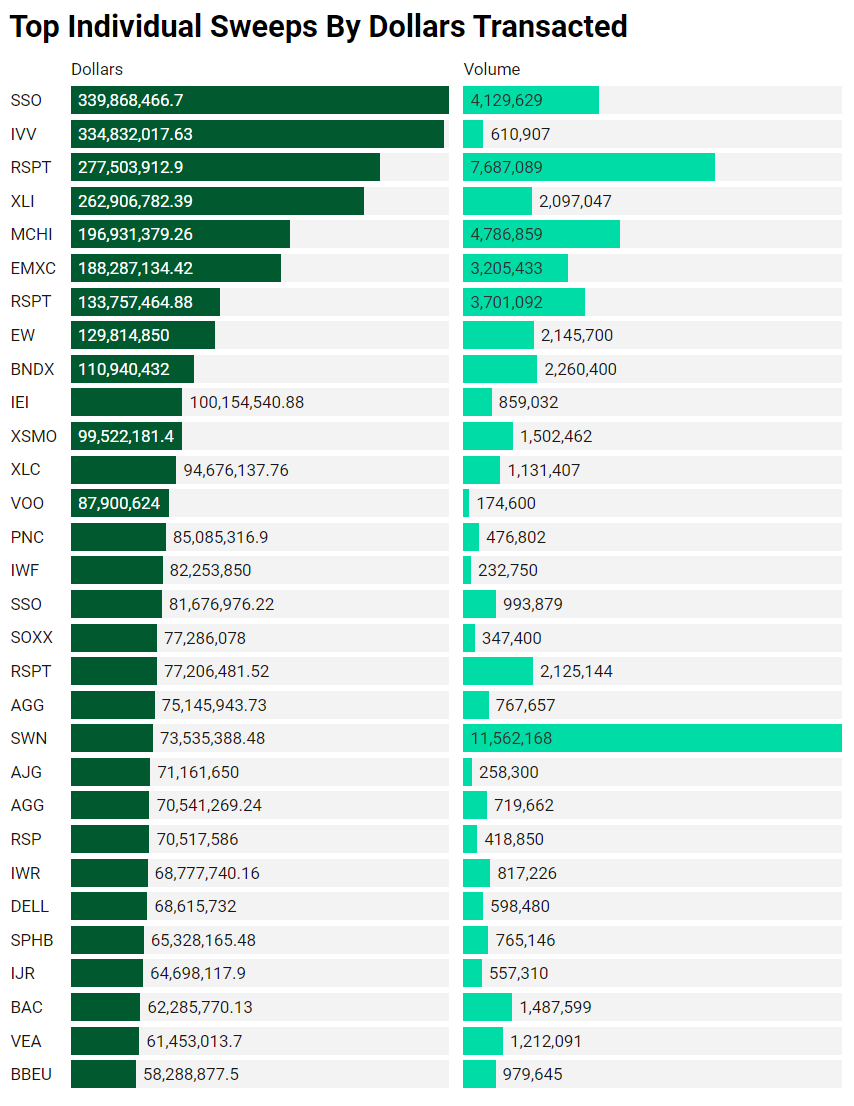
Top Institutional Order Flow
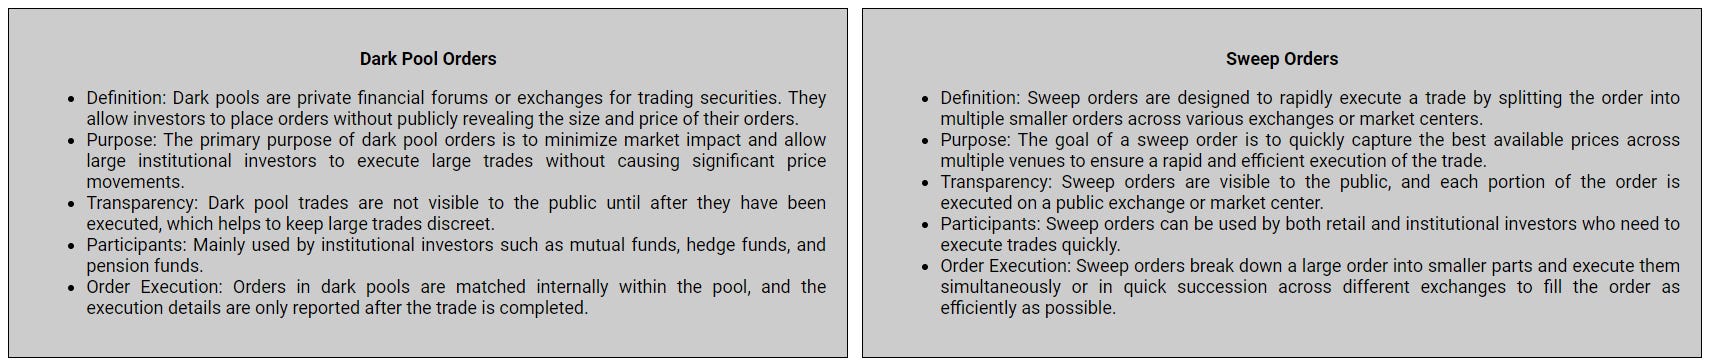
There are often great trades ideas or sources for inspiration in these prints. Only the top 30 of each group are shown but the full results are available in VL for you to browse at your leisure. Don’t forget to setup trade alerts inside the platform so you never miss institutional order flow that piques your interest or is otherwise important to you. Blue charts include all trade types including blocks on lit exchanges; red/orange charts are dark pool only trades; green charts are sweeps only.
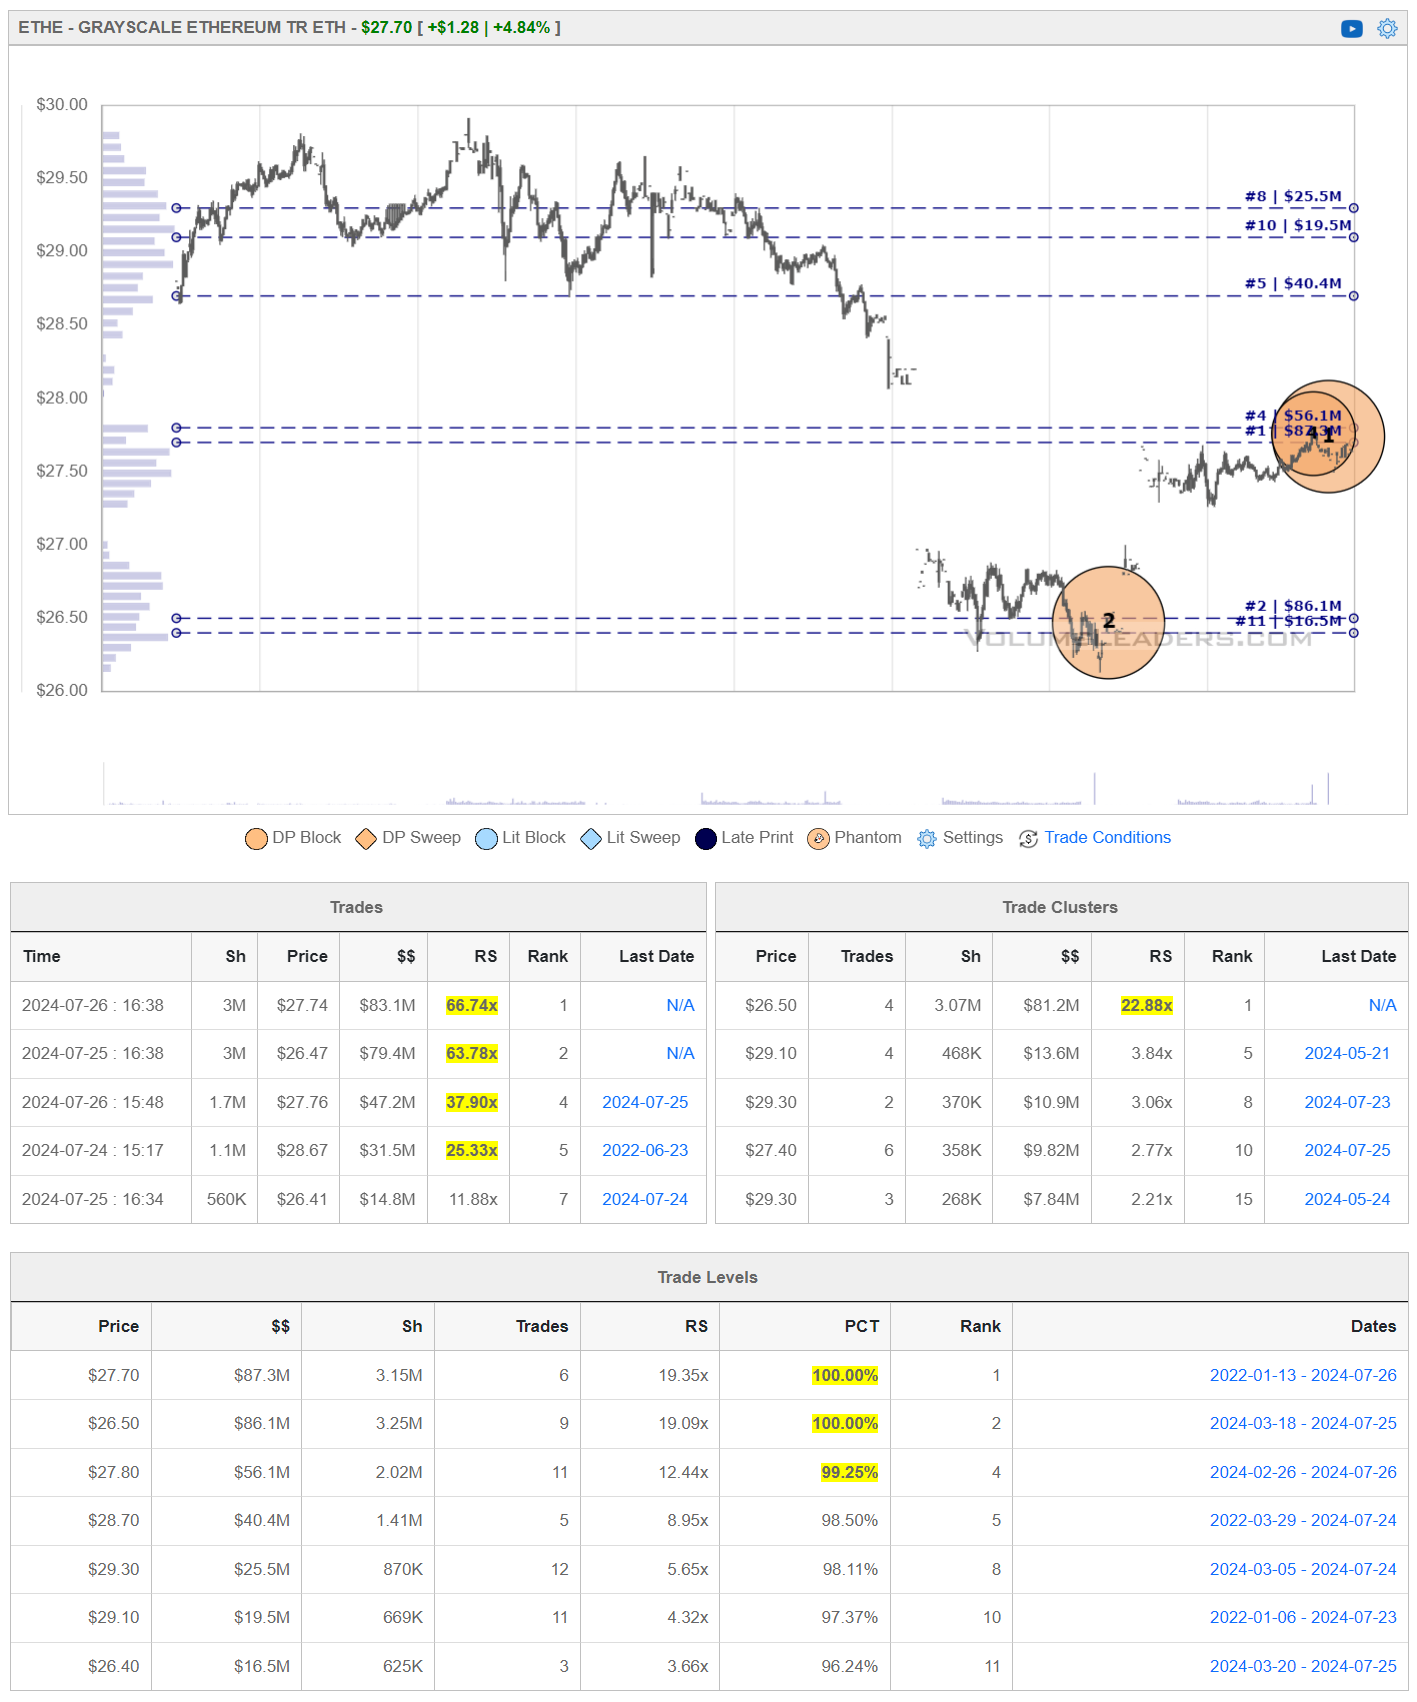
Institutional S/R Levels For Individual Tickers
Please read “Institutional S/R Levels For Major Indices” at the top of this stack to understand the nature and importance of what we’re looking at here visually. Institutions leave footprints that VL can illustrate for you while providing context to assess things institutional conviction and urgency.
Institutions are always looking for underperformers with potential; as such, there is never a shortage of compelling trade ideas in the VL platform but this week in particular was just an absolute blitz of constant institutional positioning and jockeying. This is just a small sample of what the VL Discord was breaking down in the discussion channels and building trade theses around.
ETHE
Despite the excitement surrounding the new Ethereum Mini Trust, ETHE saw substantial net outflows during the week. On July 25, ETHE experienced a record outflow of $152.3 million. This outflow was part of broader movements in the market where other Ether ETFs saw inflows, balancing the overall impact on Ethereum ETF investments
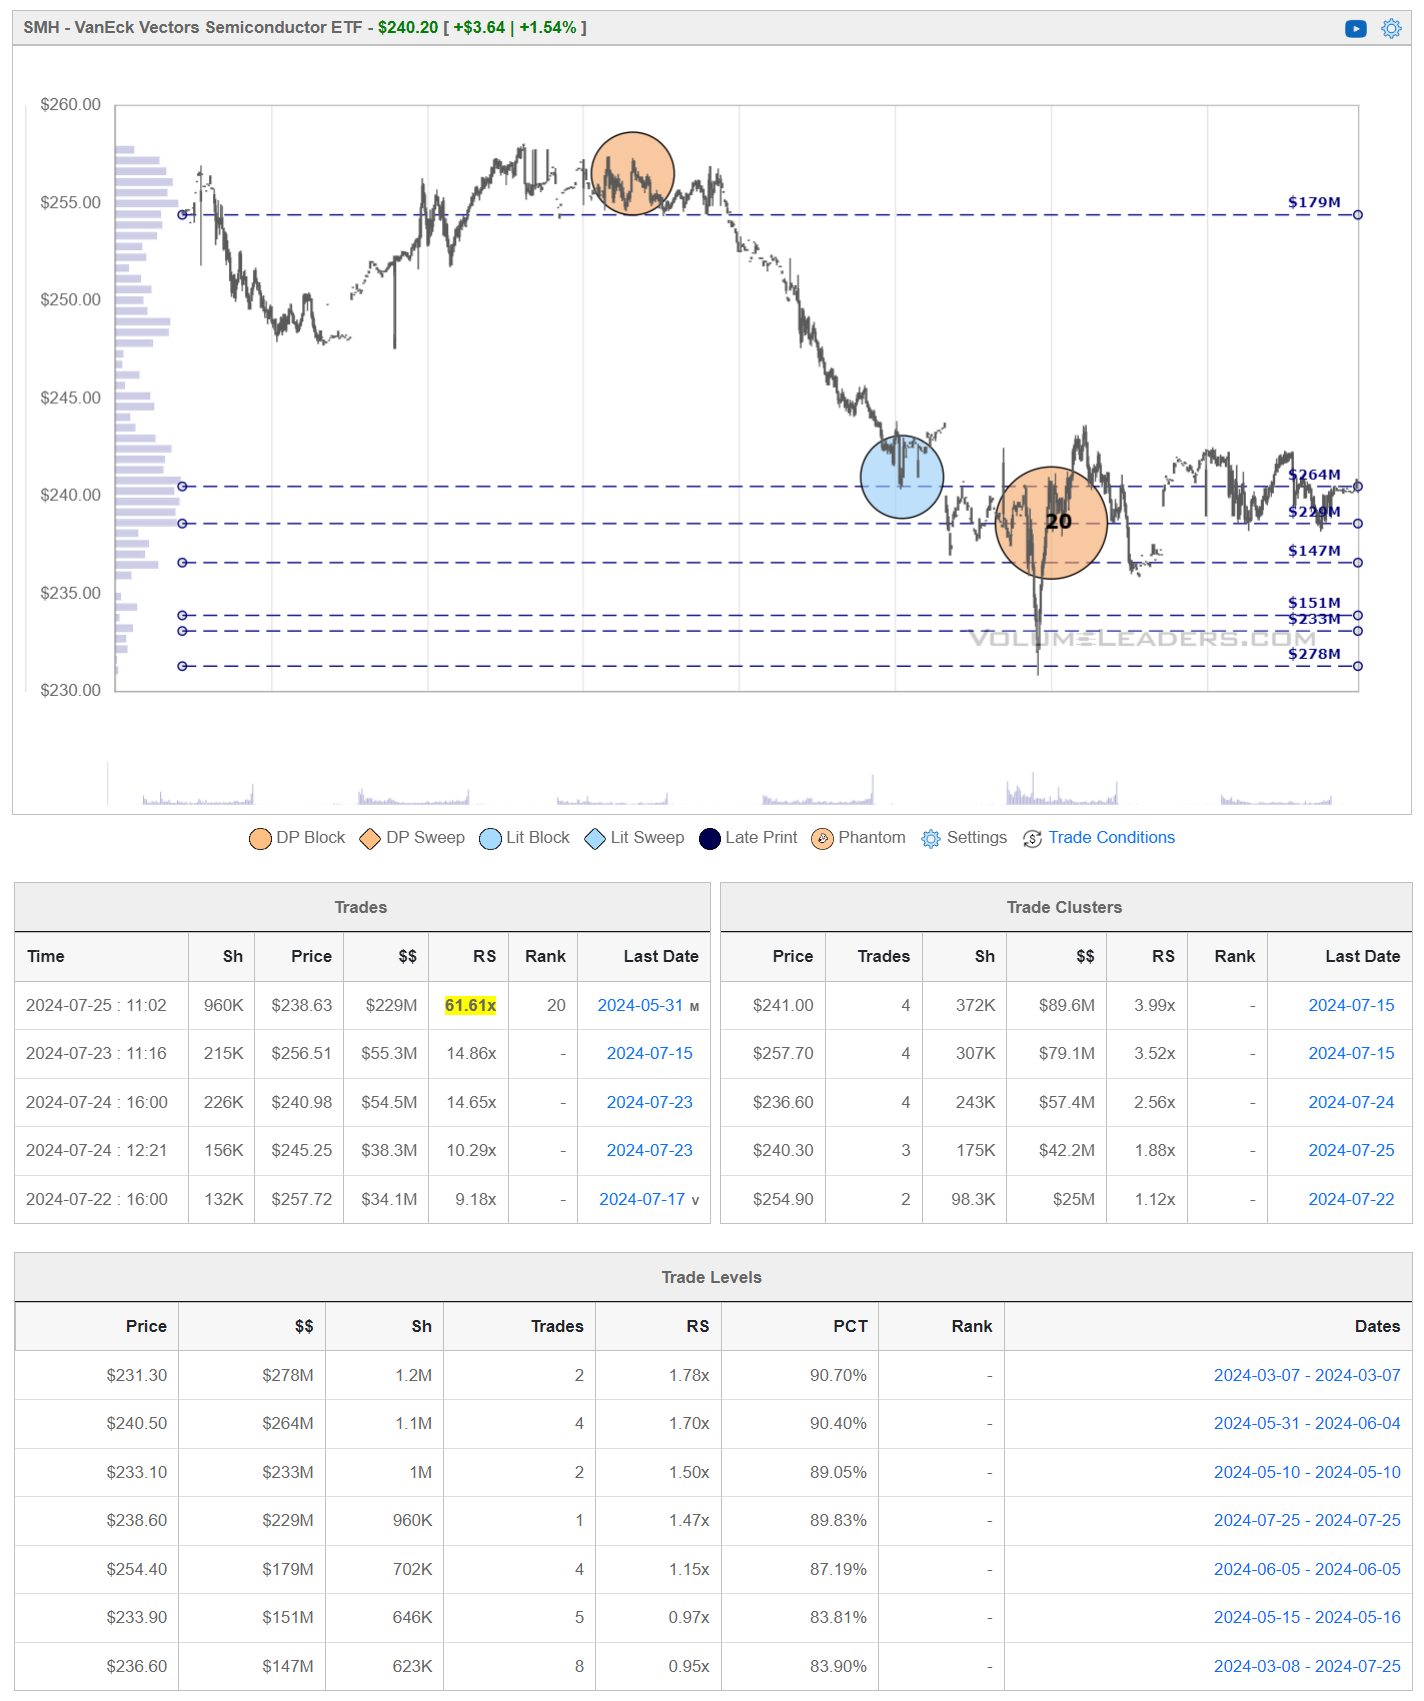
SMH
The VanEck Semiconductor ETF (SMH) is an exchange-traded fund designed to track the performance of the MVIS US Listed Semiconductor 25 Index. This index includes 25 of the most liquid and prominent companies in the semiconductor industry. The fund aims to replicate the price and yield performance of the index, providing investors with exposure to the semiconductor sector.
SMH faced significant declines this week due to geopolitical tensions impacting the semiconductor industry. Rising U.S.-China trade conflicts have led to increased concerns over supply chain disruptions, negatively affecting semiconductor stocks after remarks by Biden.
LVMUY
LABU
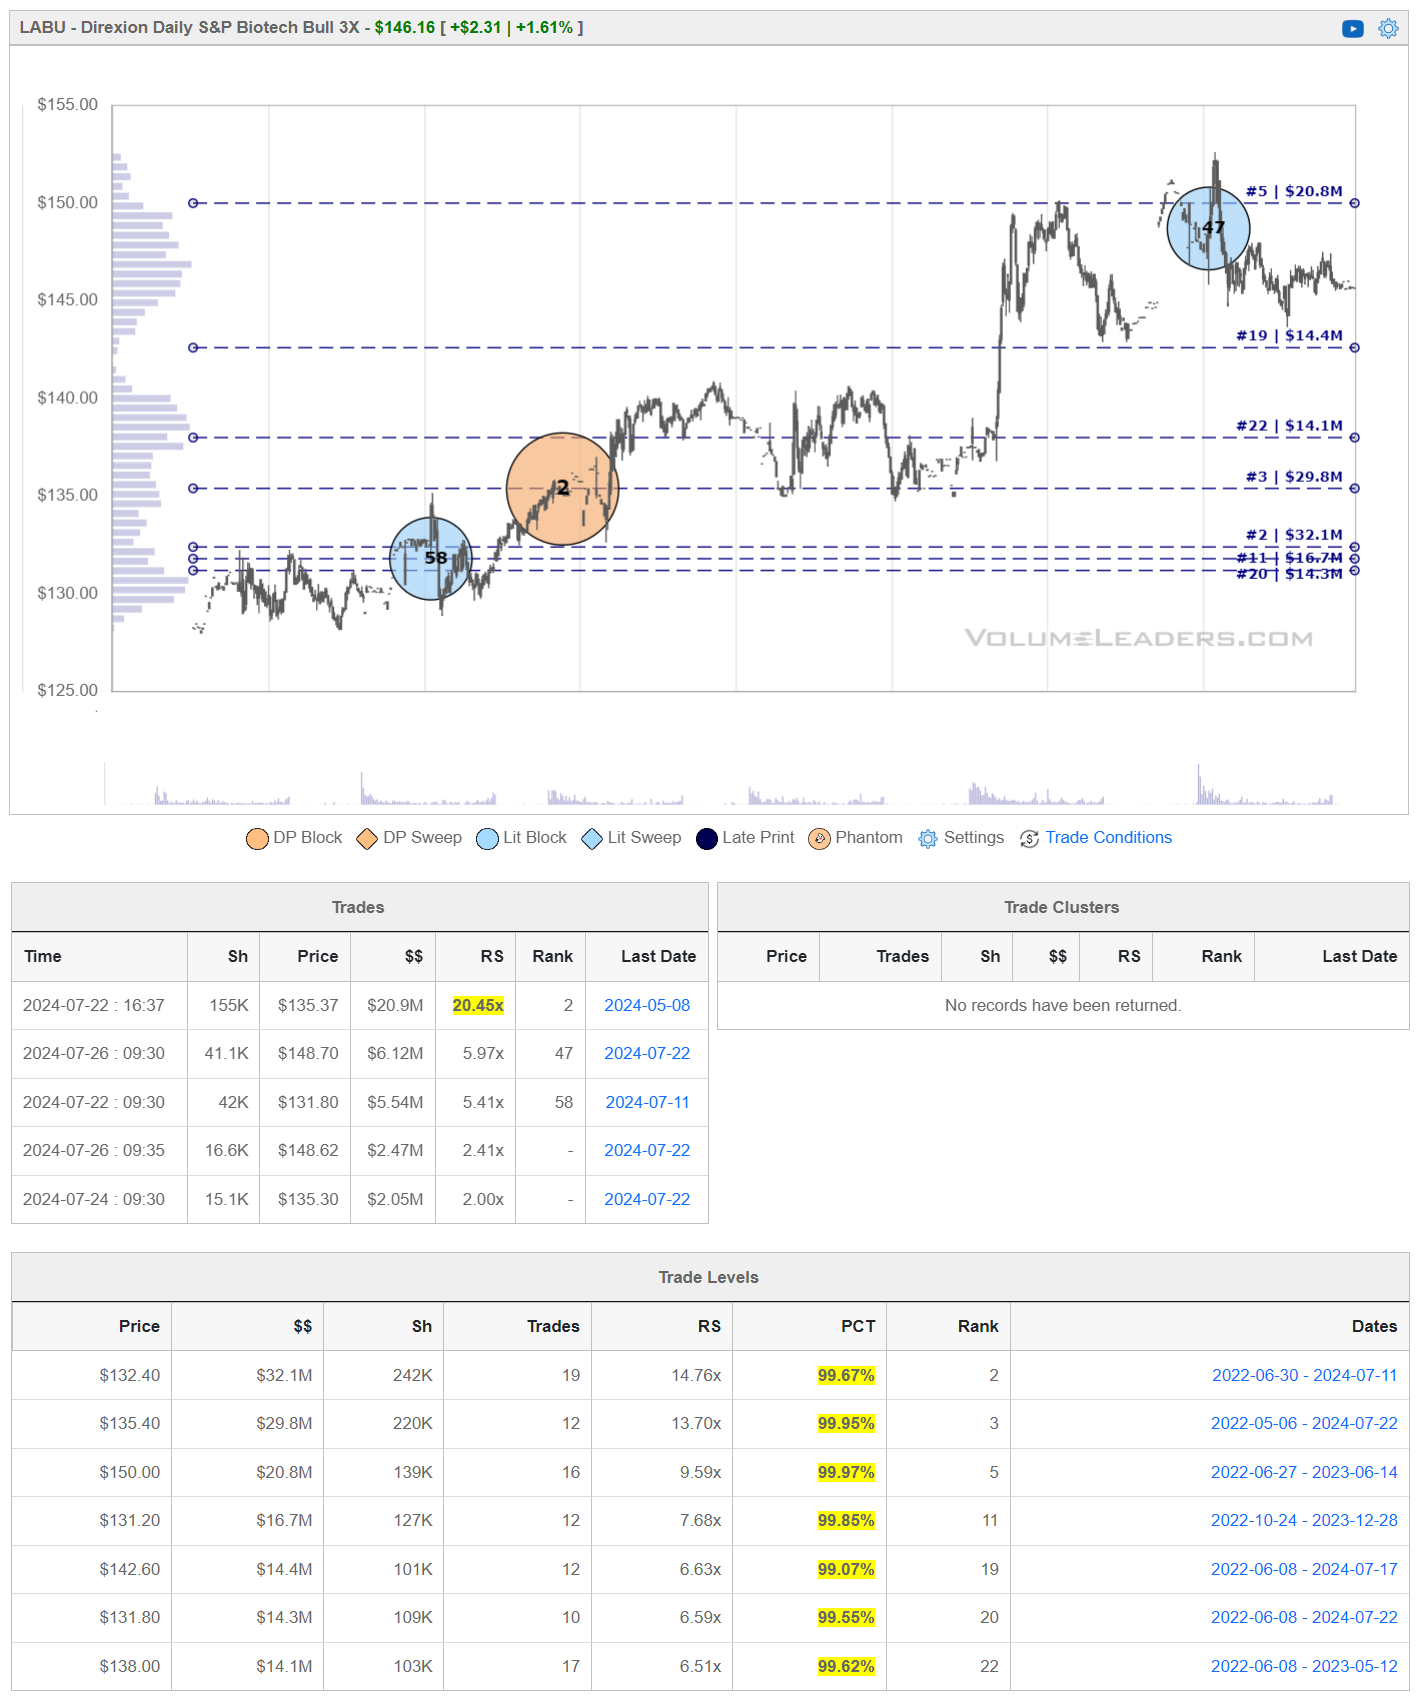
The Direxion Daily S&P Biotech Bull 3X Shares (LABU) is a leveraged exchange-traded
fund (ETF) that aims to provide three times (3x) the daily performance of the S&P Biotechnology Select Industry Index. This means for every 1% movement in the index, LABU aims to move by 3% in the same direction on a daily basis, making it suitable for short-term trading rather than long-term holding due to the daily reset of leverage.
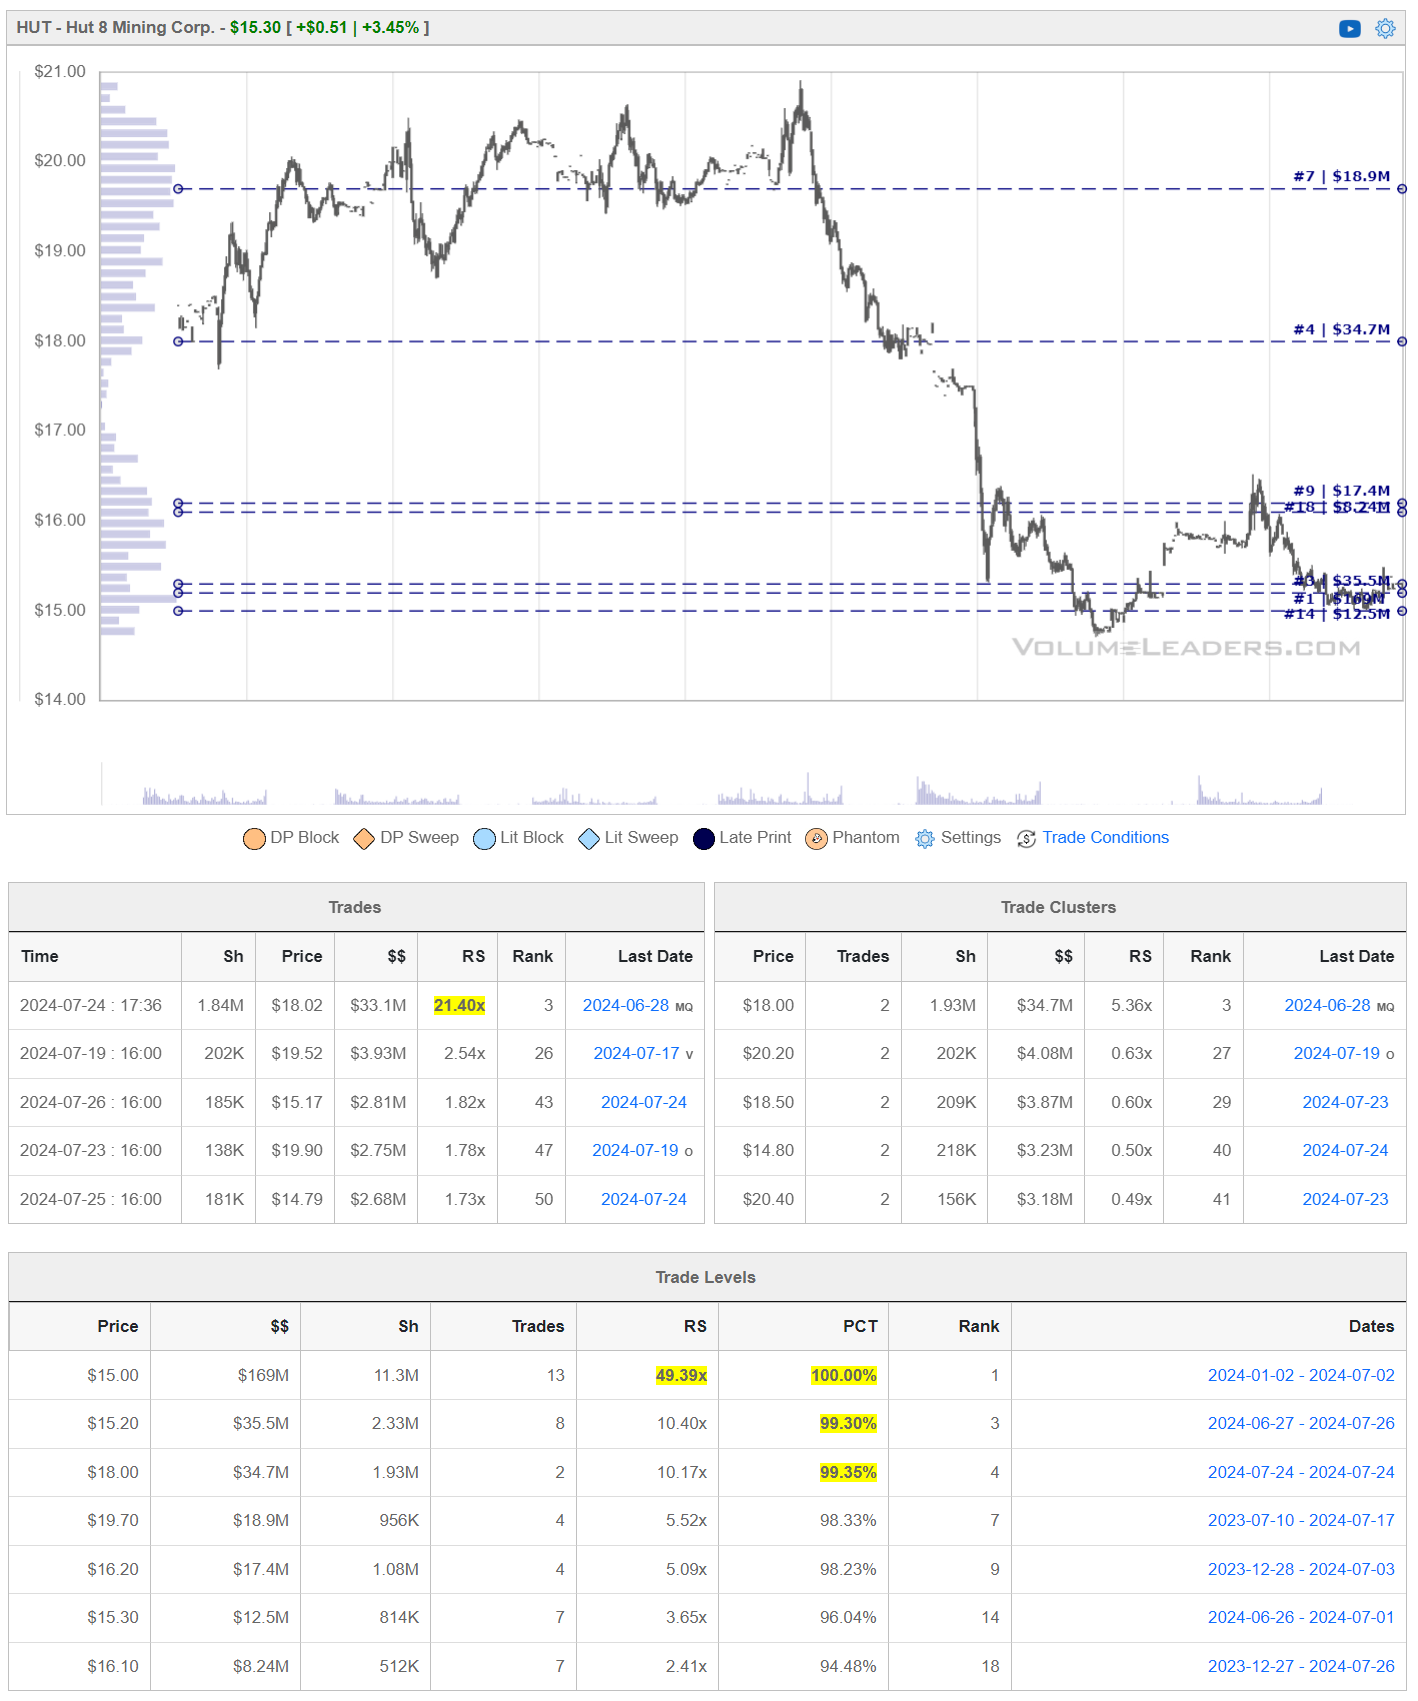
Hut 8 Corp. HUT is a leading Bitcoin mining company and a vertically integrated operator of large-scale energy infrastructure in North America. The company operates in several segments, including Digital Assets Mining, Managed Services, High Performance Computing – Colocation and Cloud, and others. This diversification allows Hut 8 to not only mine Bitcoin but also offer a range of managed services and infrastructure solutions
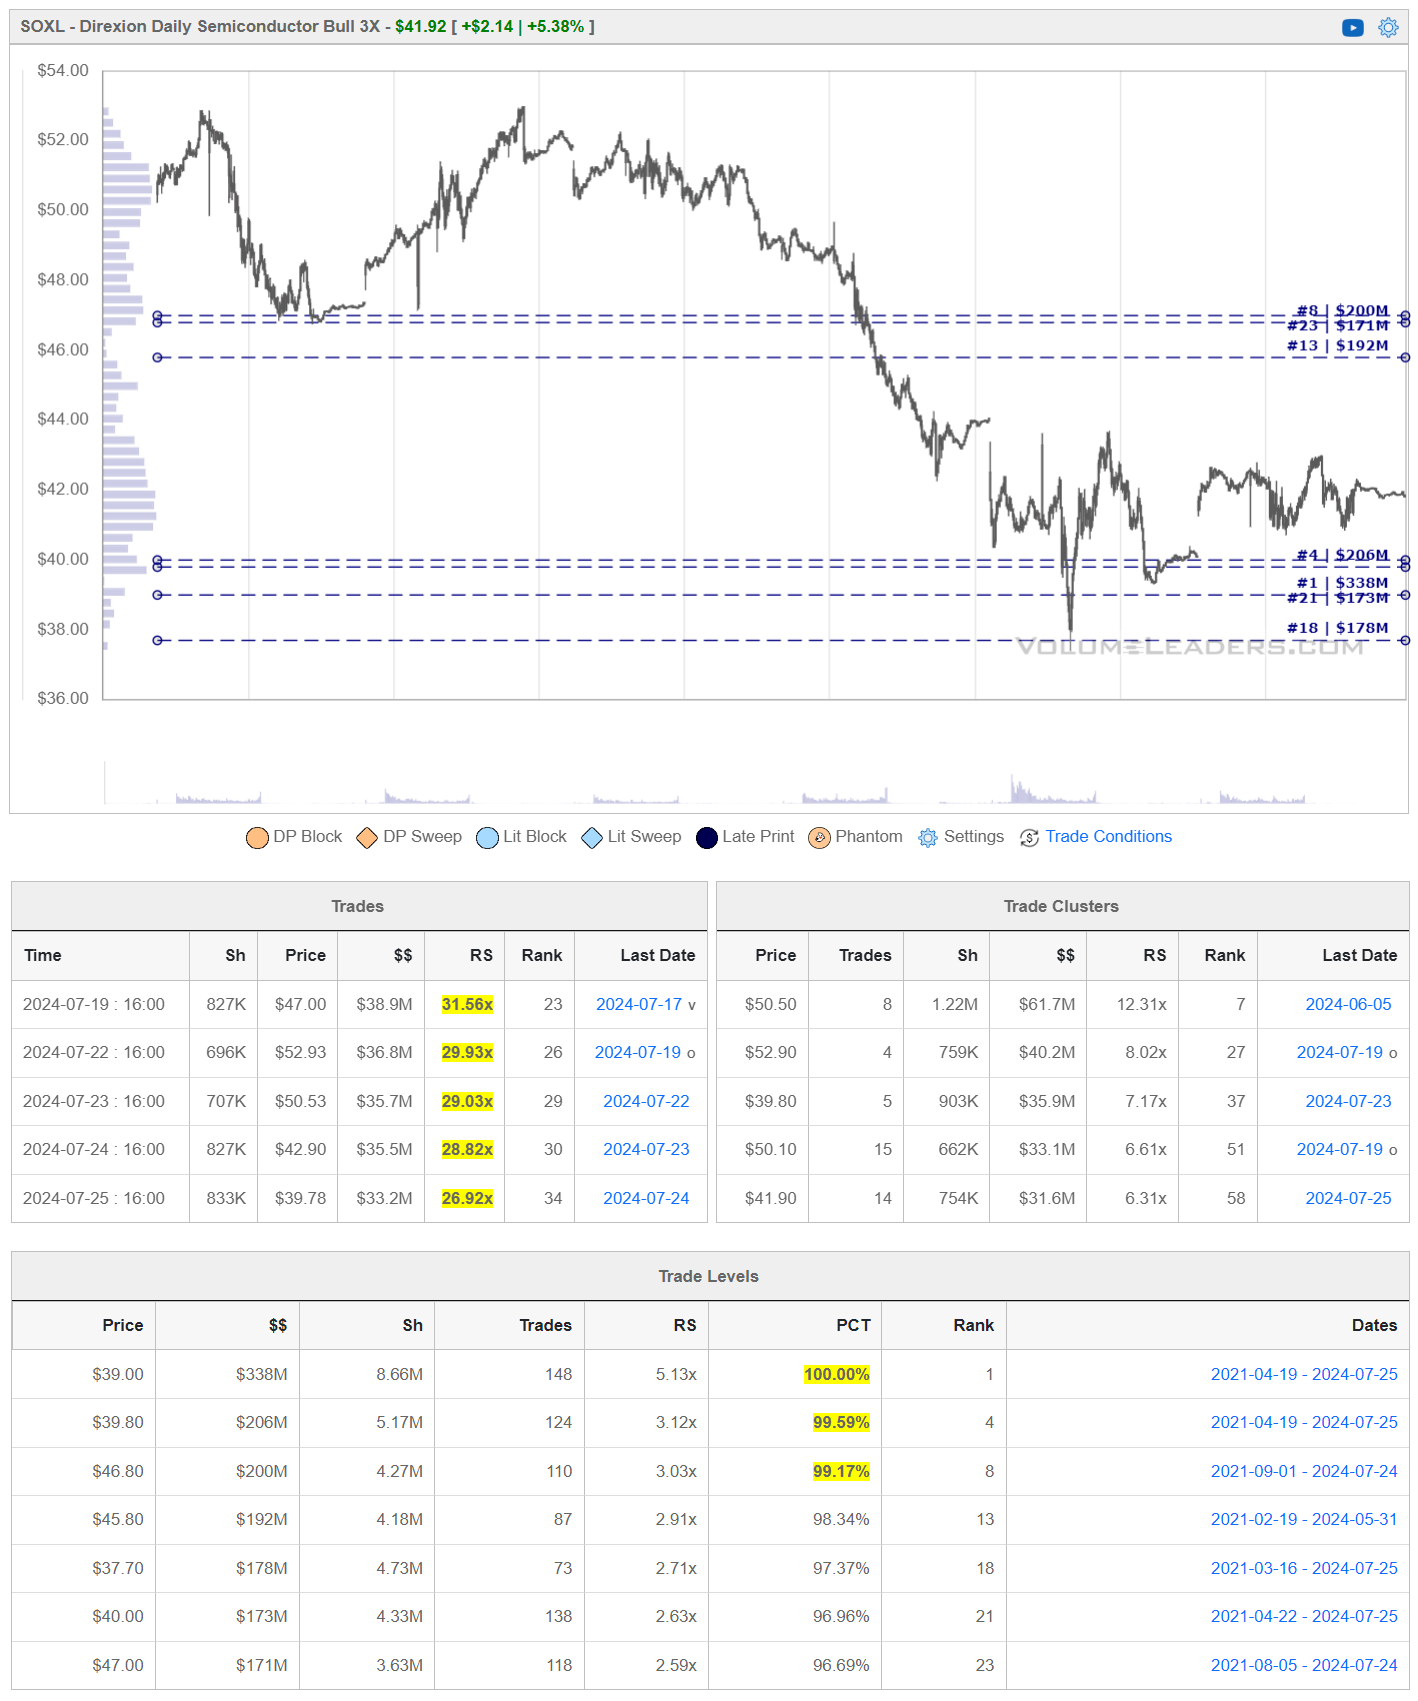
The Direxion Daily Semiconductor Bull 3X Shares SOXL is an exchange-traded fund (ETF) that provides triple (3x) leveraged daily exposure to the ICE Semiconductor Index. This index includes a market-cap-weighted collection of 30 U.S.-listed semiconductor companies. SOXL aims to amplify the performance of its underlying index, making it a high-risk, high-reward investment suitable for short-term trading strategies rather than long-term holding due to the daily reset of leverage.
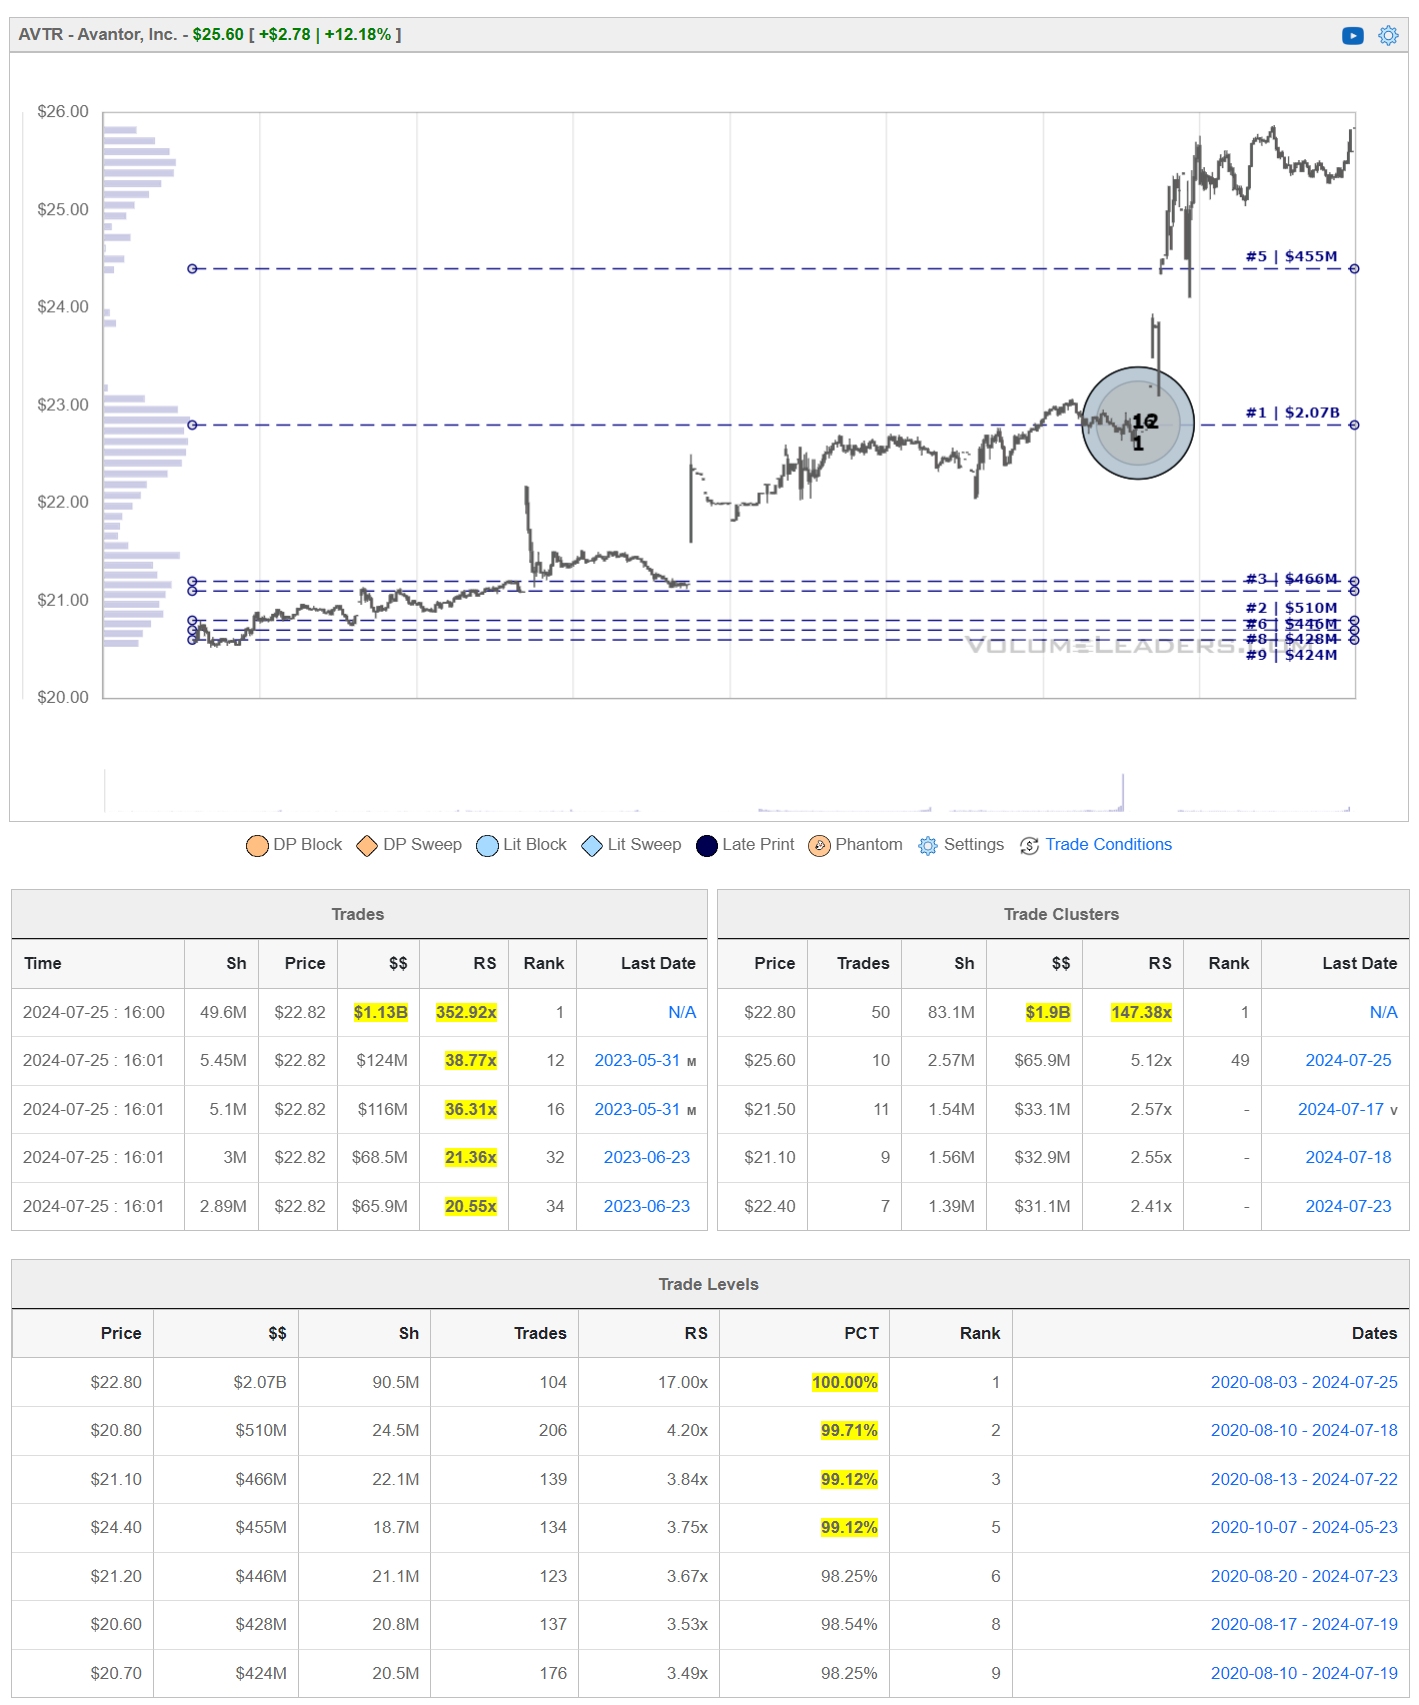
Avantor Inc. AVTR replaces QuidelOrtho Corp. QDEL in the S&P MidCap 400 and also came out with quarterly earnings of $0.25 per share, beating the Zacks Consensus Estimate of $0.23 per share, an earnings surprise of 8.70%. The company has topped consensus revenue estimates three times over the last four quarters. Altogether, enough for a respectable lift; note the inventory collected at the lows and before being taken higher.
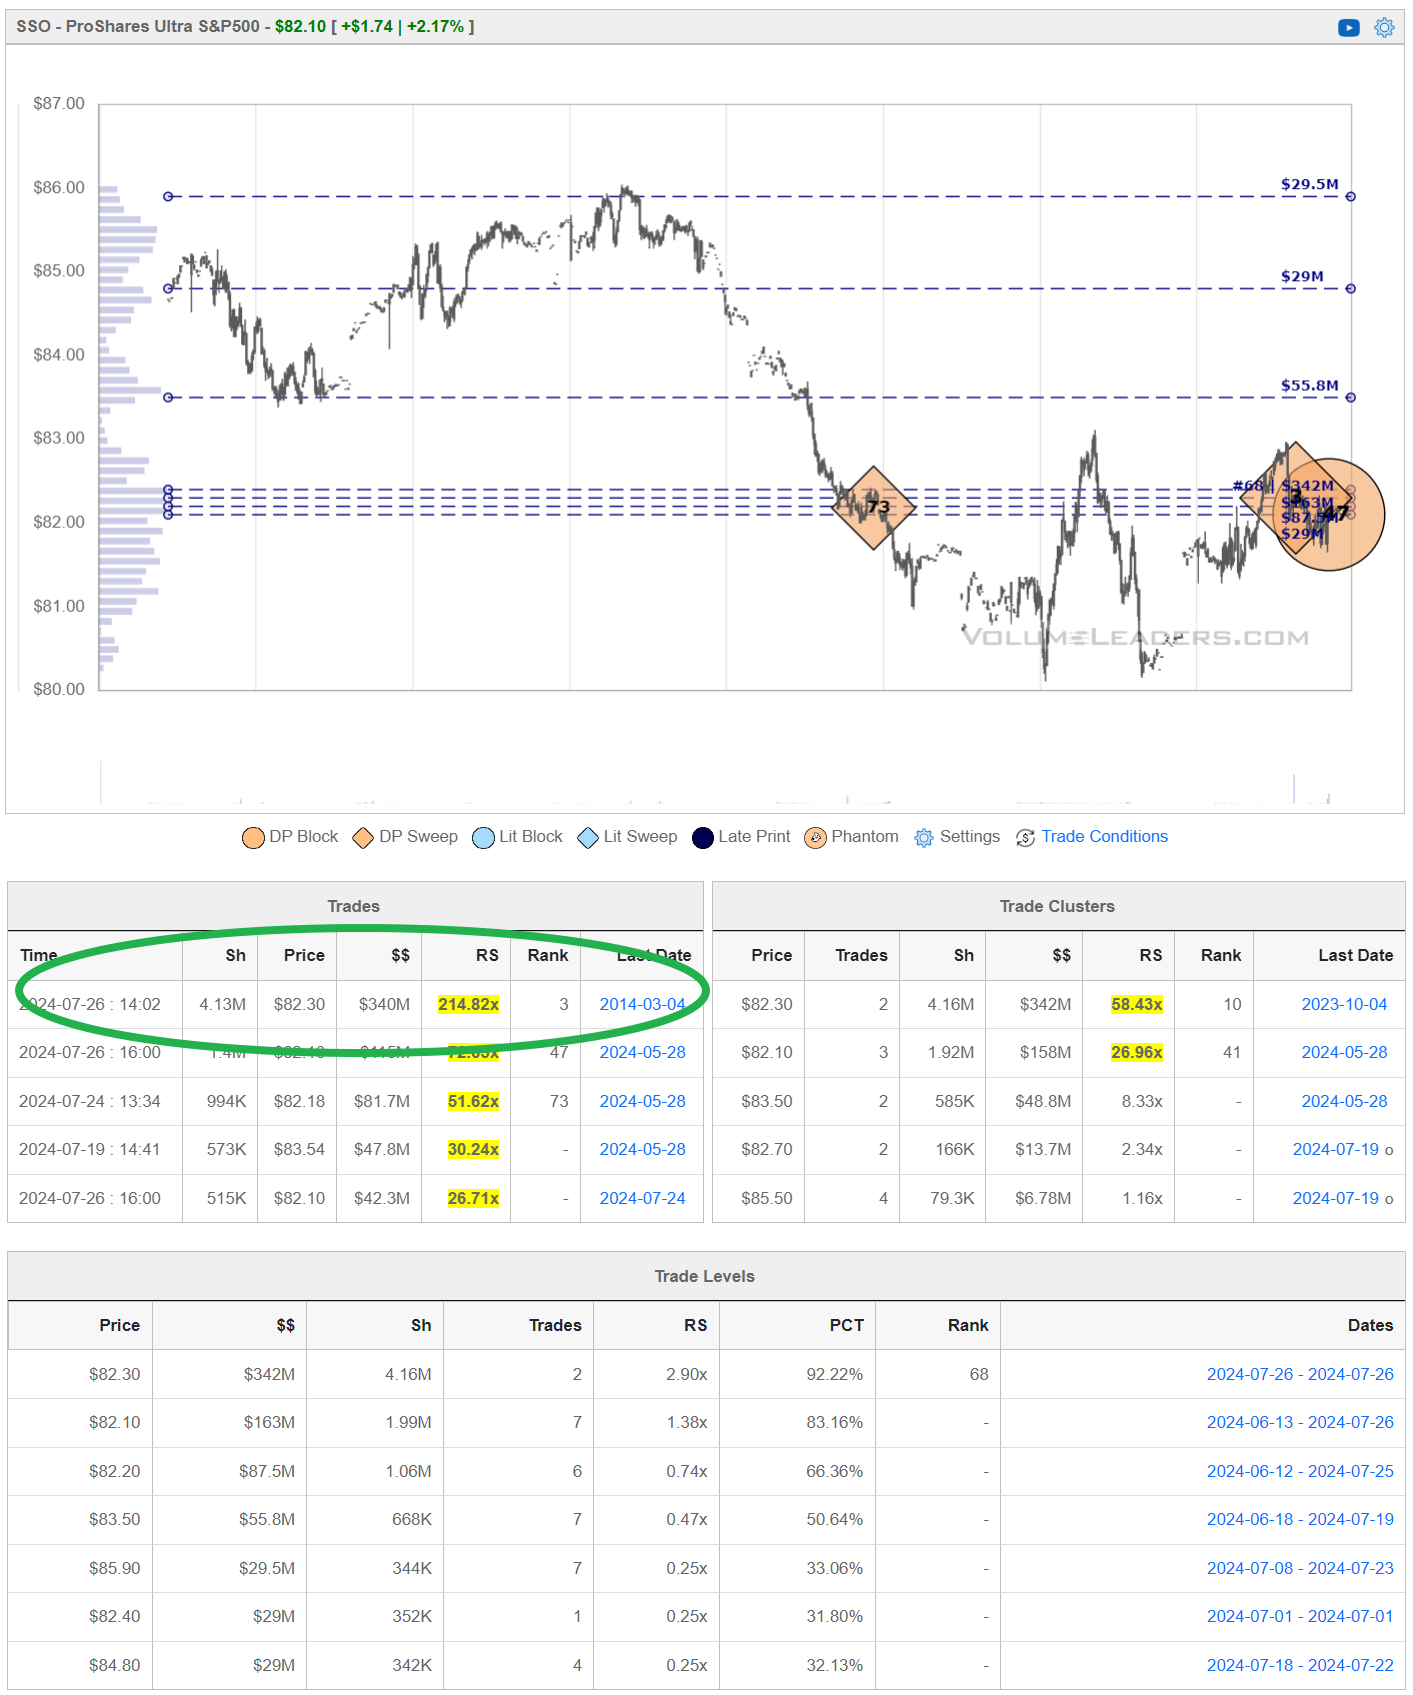
The ProShares Ultra S&P500 SSO is an exchange-traded fund (ETF) designed to provide 2x leveraged daily exposure to the S&P 500 Index. This means that for every 1% movement in the S&P 500, SSO aims to move by 2% in the same direction on a daily basis. Due to this leverage, SSO is suitable for short-term trading rather than long-term holding, as daily compounding can lead to significant performance divergence from the underlying index over time.
Below you can plainly see the #3 all-time ranked trade - certainly nothing to scoff at. Keep an eye on that level in coming sessions so you know which way the wind is blowing as you trade.
Advanced Micro Devices, Inc. AMD is a global semiconductor company that designs and manufactures microprocessors, GPUs, and related technologies for computer processing, data centers, and gaming. Founded in 1969 and headquartered in Santa Clara, California, AMD is known for its innovative technology solutions in the semiconductor industry.

The ProShares Ultra Bloomberg Natural Gas ETF (BOIL) is a leveraged exchange-traded fund designed to provide twice (2x) the daily performance of the Bloomberg Natural Gas Subindex, which tracks the performance of natural gas futures contracts. BOIL aims to amplify the returns of natural gas movements, making it suitable for short-term traders looking to capitalize on natural gas price fluctuations.
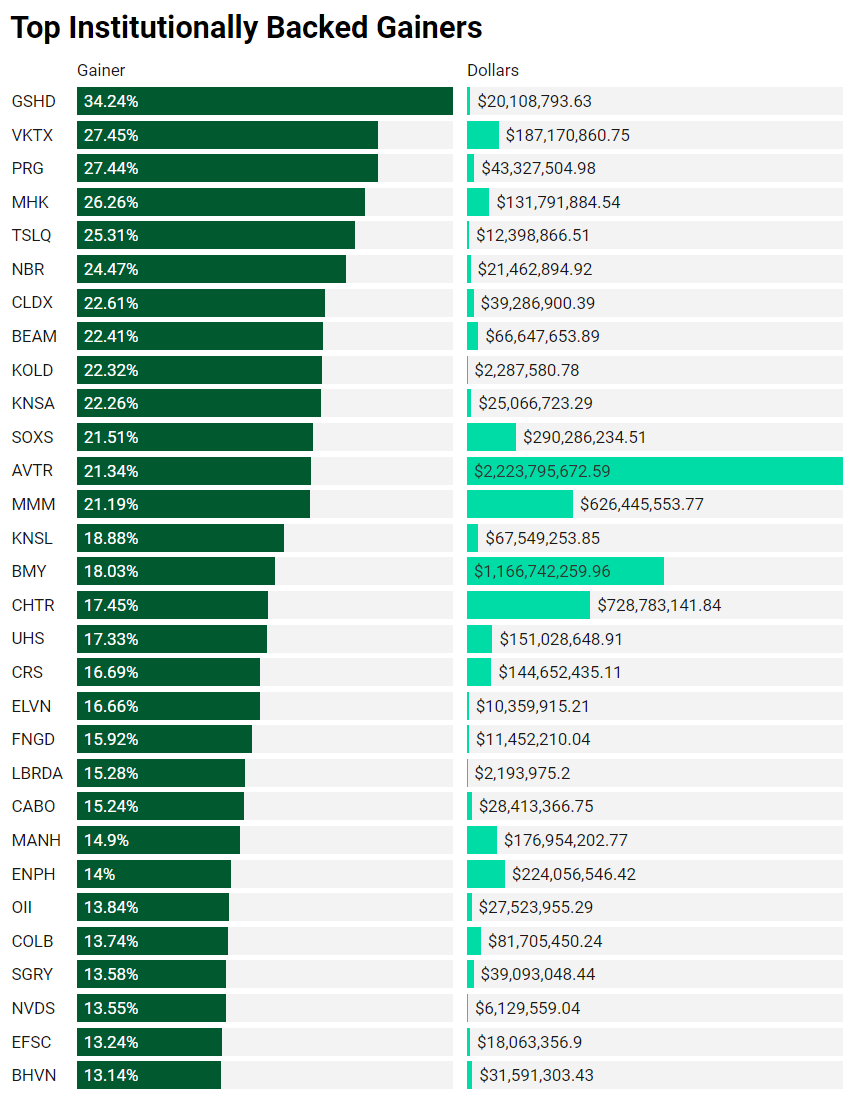
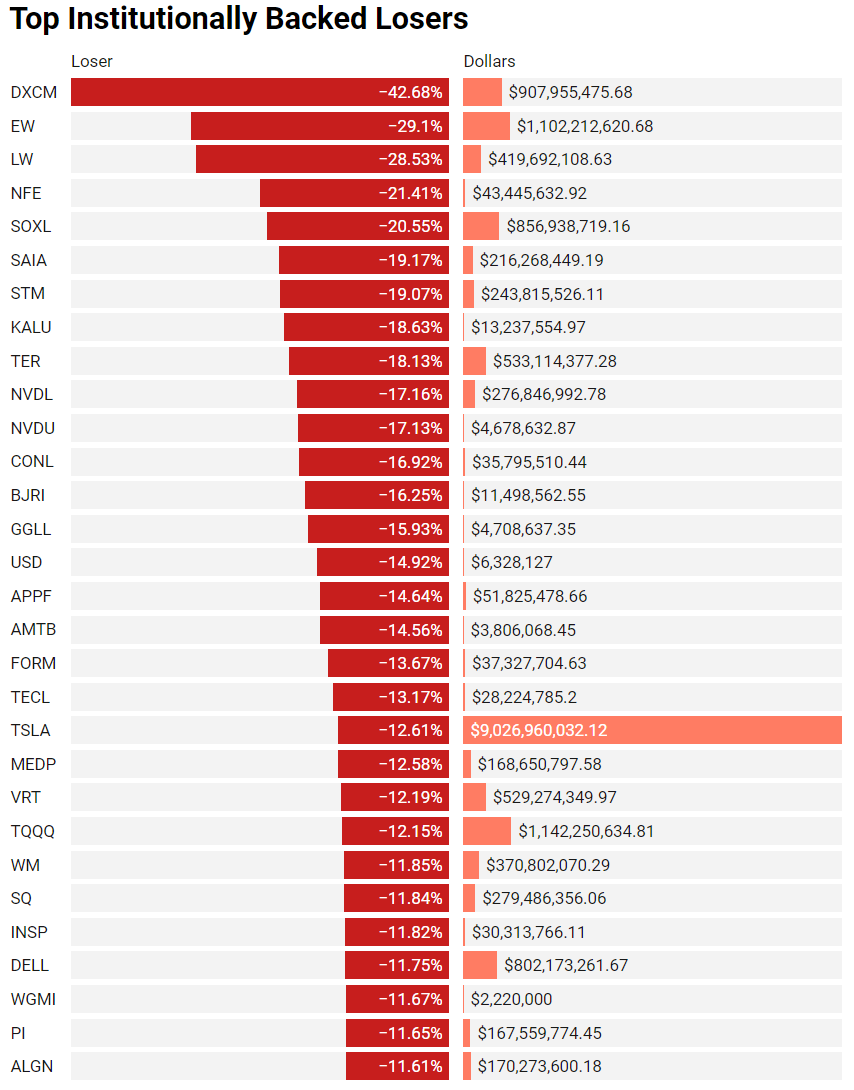
Institutionally-Backed Gainers & Losers
If you’re going to bet on a horse, consider one that is officially endorsed by an institution! These are the top percent gainers (green) and and percent losers (red) from this week’s open-to-close that had a trade price greater than $20 and institutional involvement. Continue watching tickers from prior stacks as these frequently turn into multi-leg trades with a lot of movement!
Get these screened tickers in your inbox every week, just subscribe for free below.
Billionaire Boys Club
Tickers that printed a trade worth at least $1B last week get a special shout-out. Welcome to the club. The table below is sortable, searchable and paginated (if there are enough results; some weeks are busier than others). Login to VL to get the exact trade price and relevant institutional levels around the trade.
Summary Of Thematic Performance
VL provides a lot of pre-built filters for thematics so that you can quickly dive into specific areas of the market. These performance overviews are provided here only for inspiration. Consider targeting leaders and/or laggards in the best and worst sectors, for example.
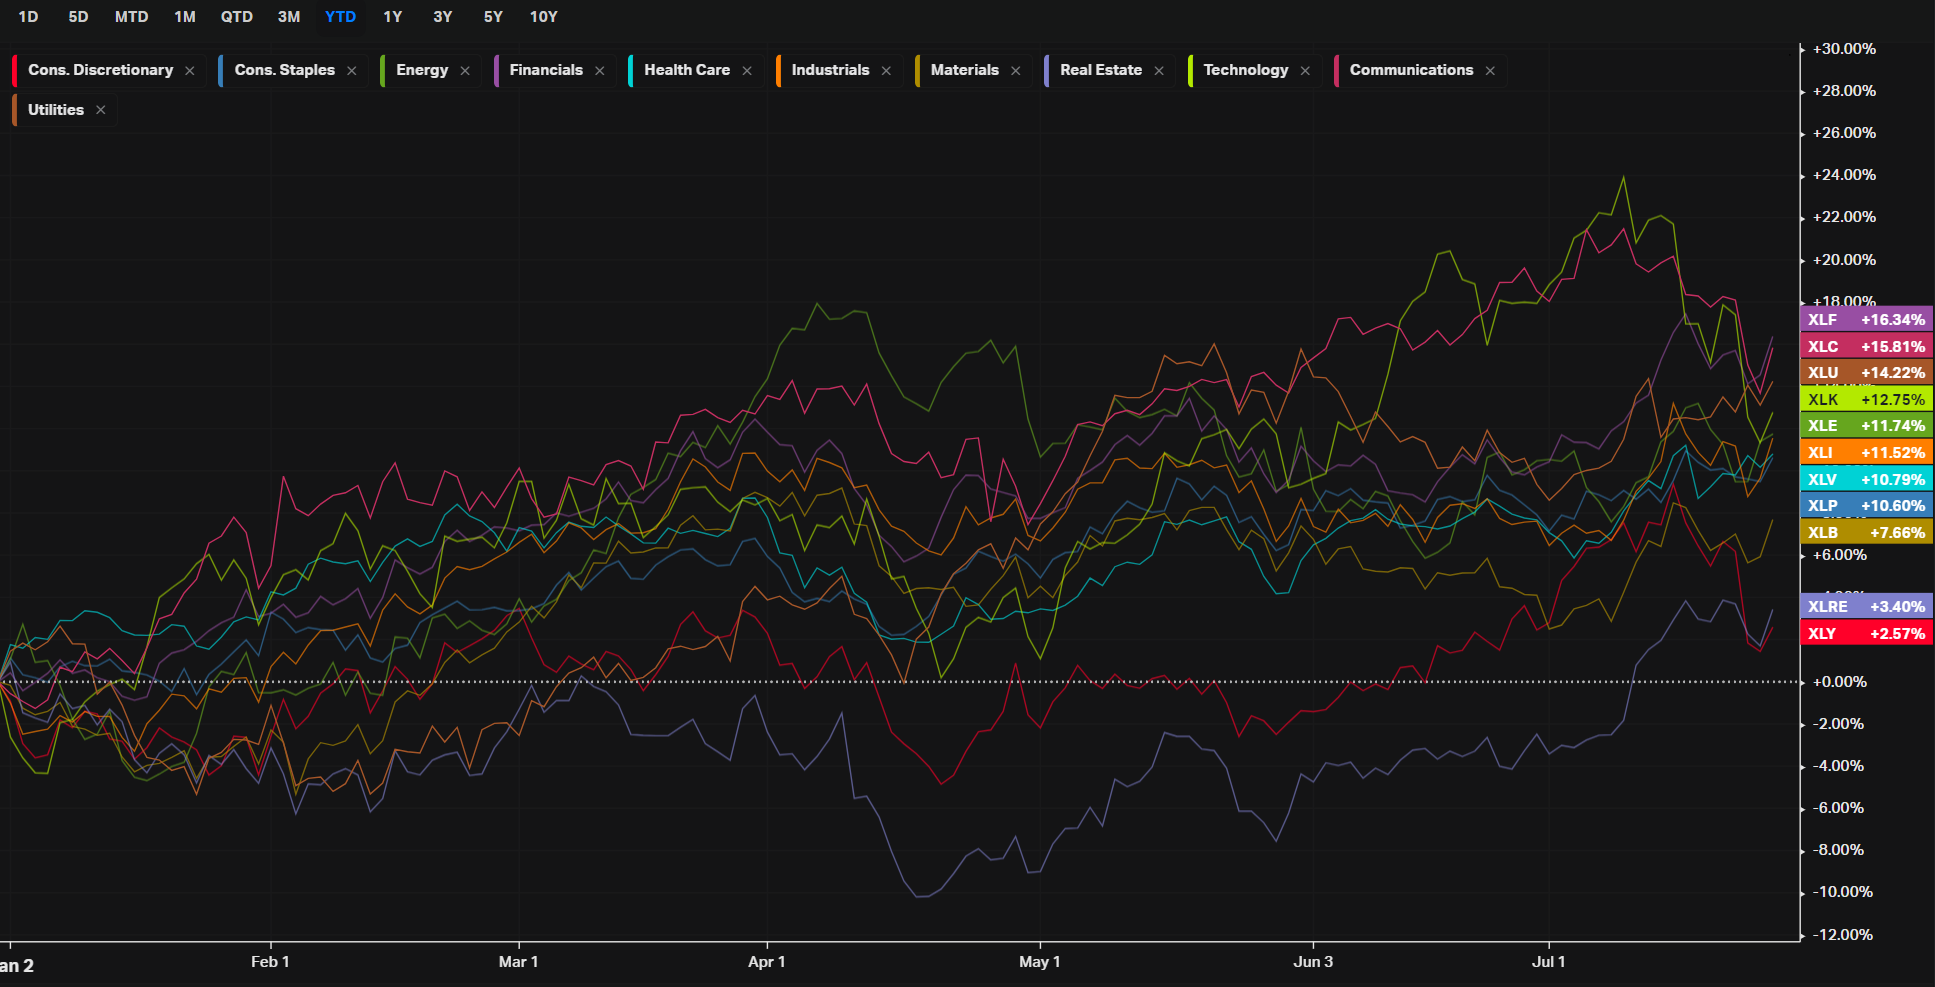
YTD S&P Sector Performance
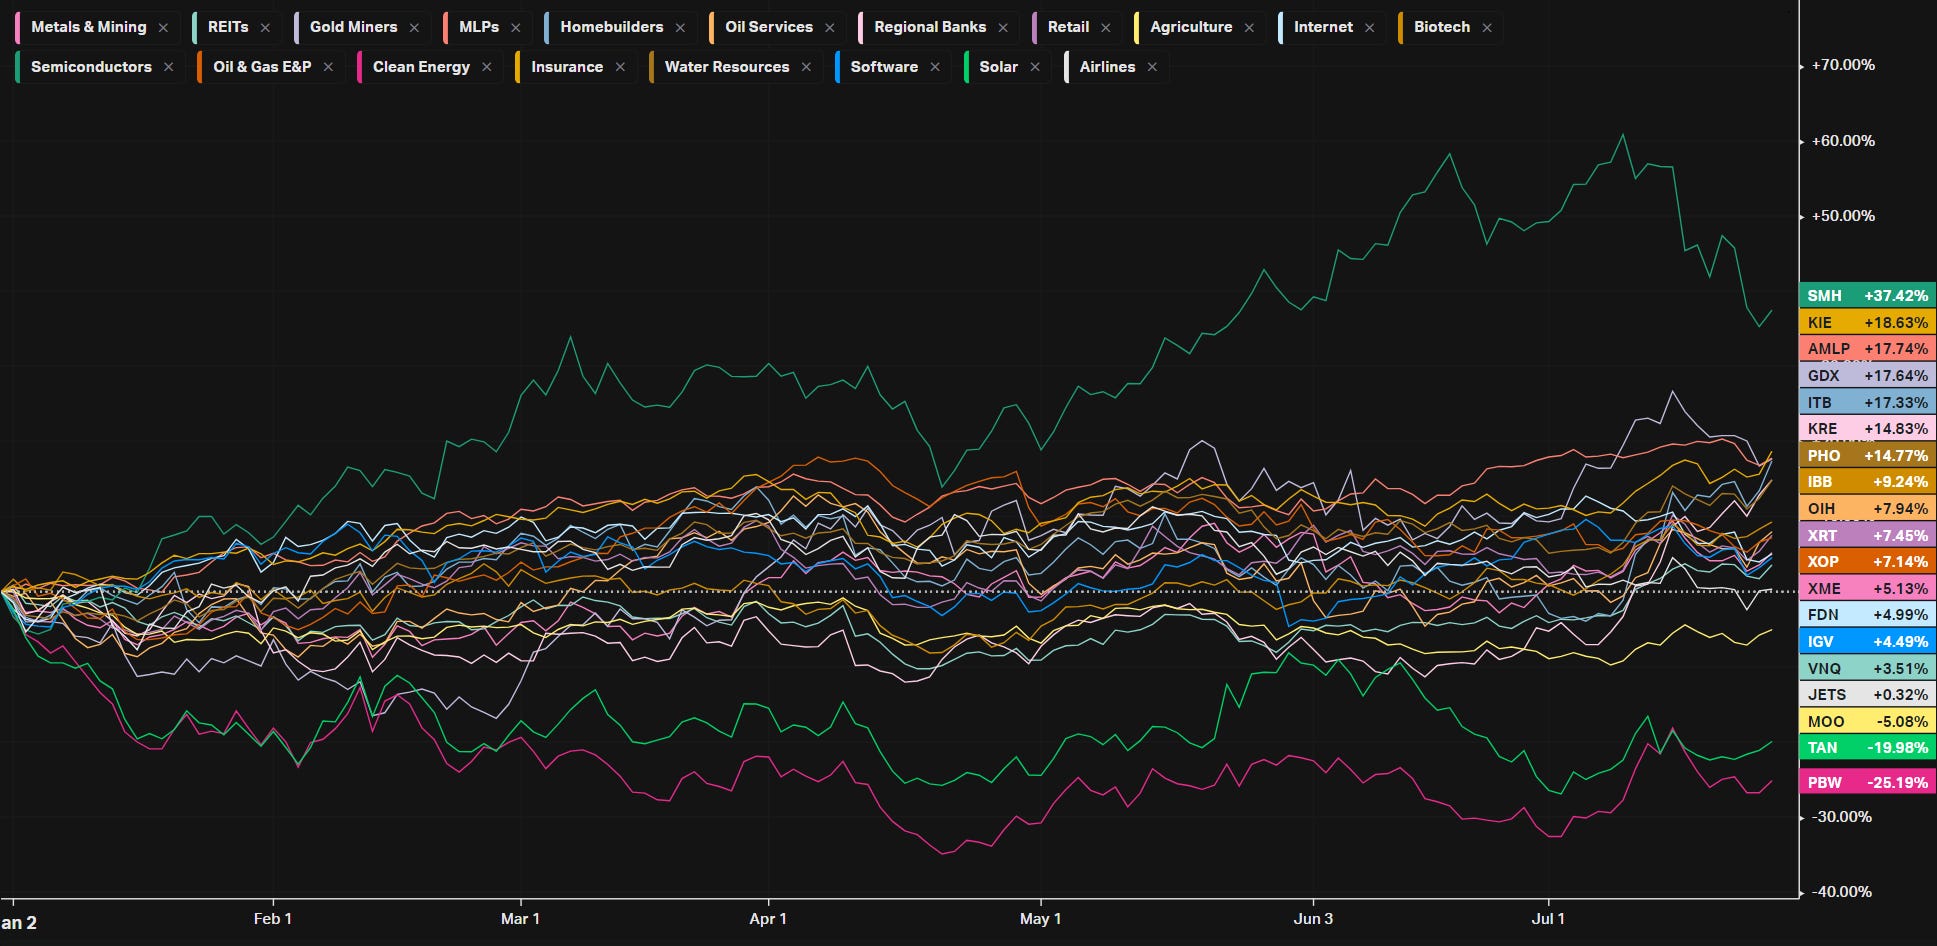
YTD S&P Industry Performance
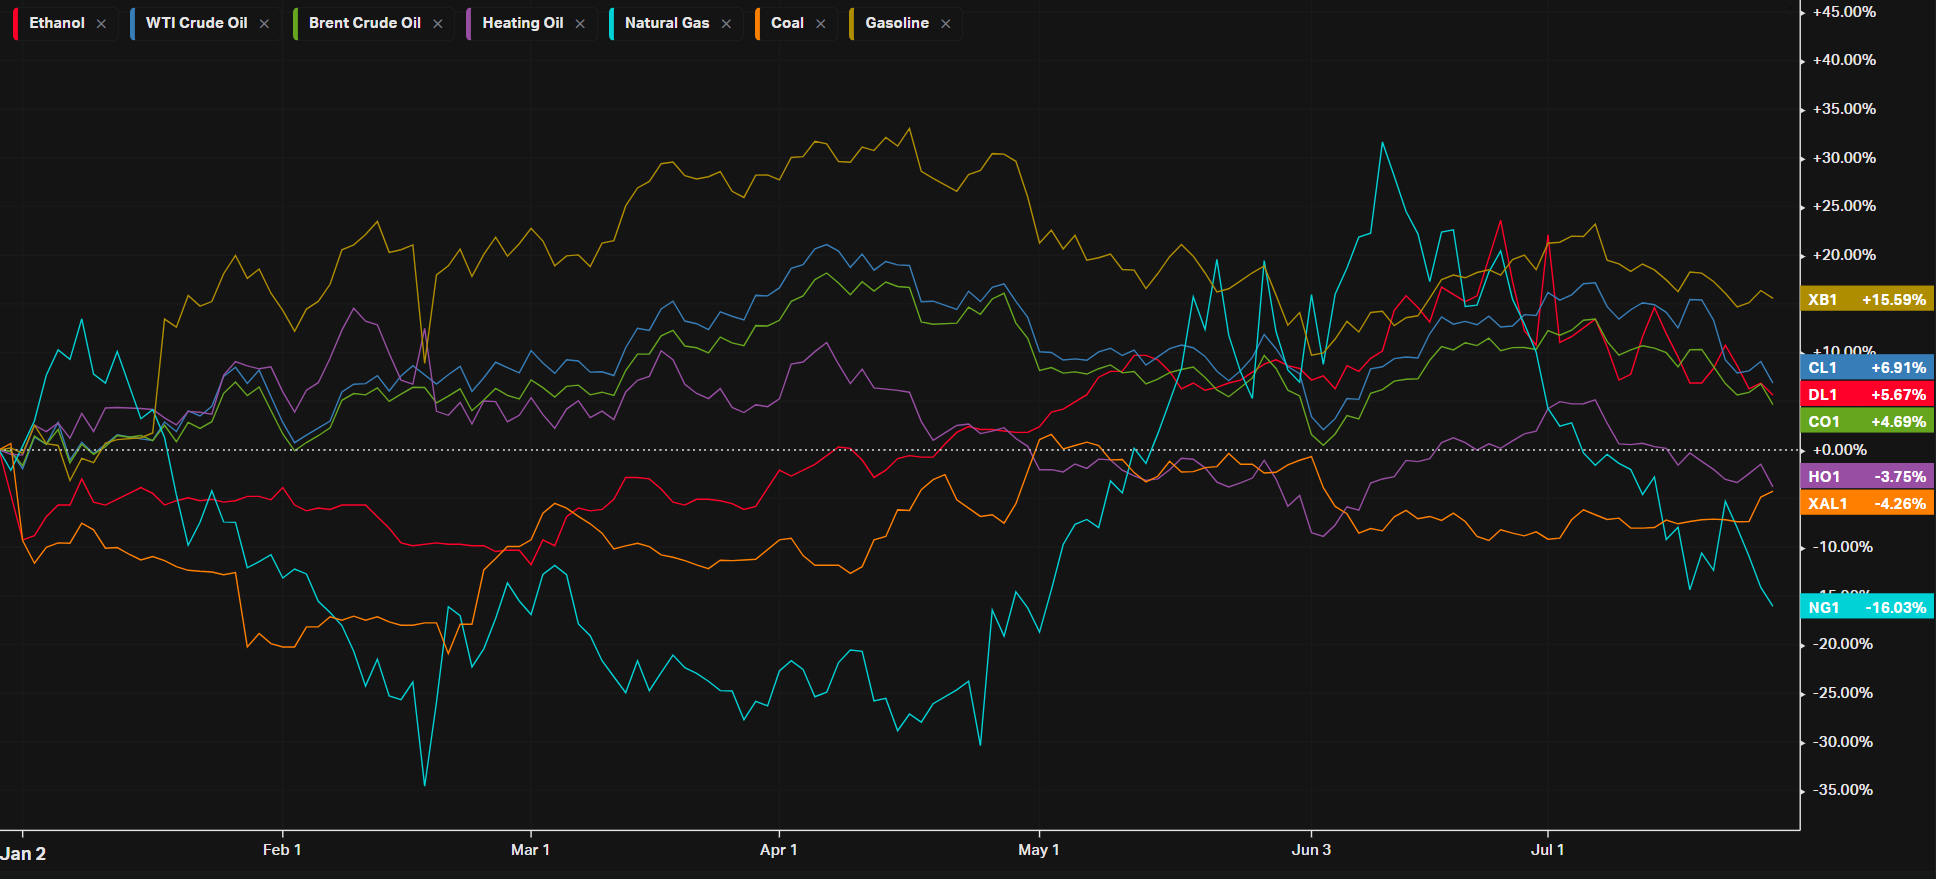
YTD Performance: Energy
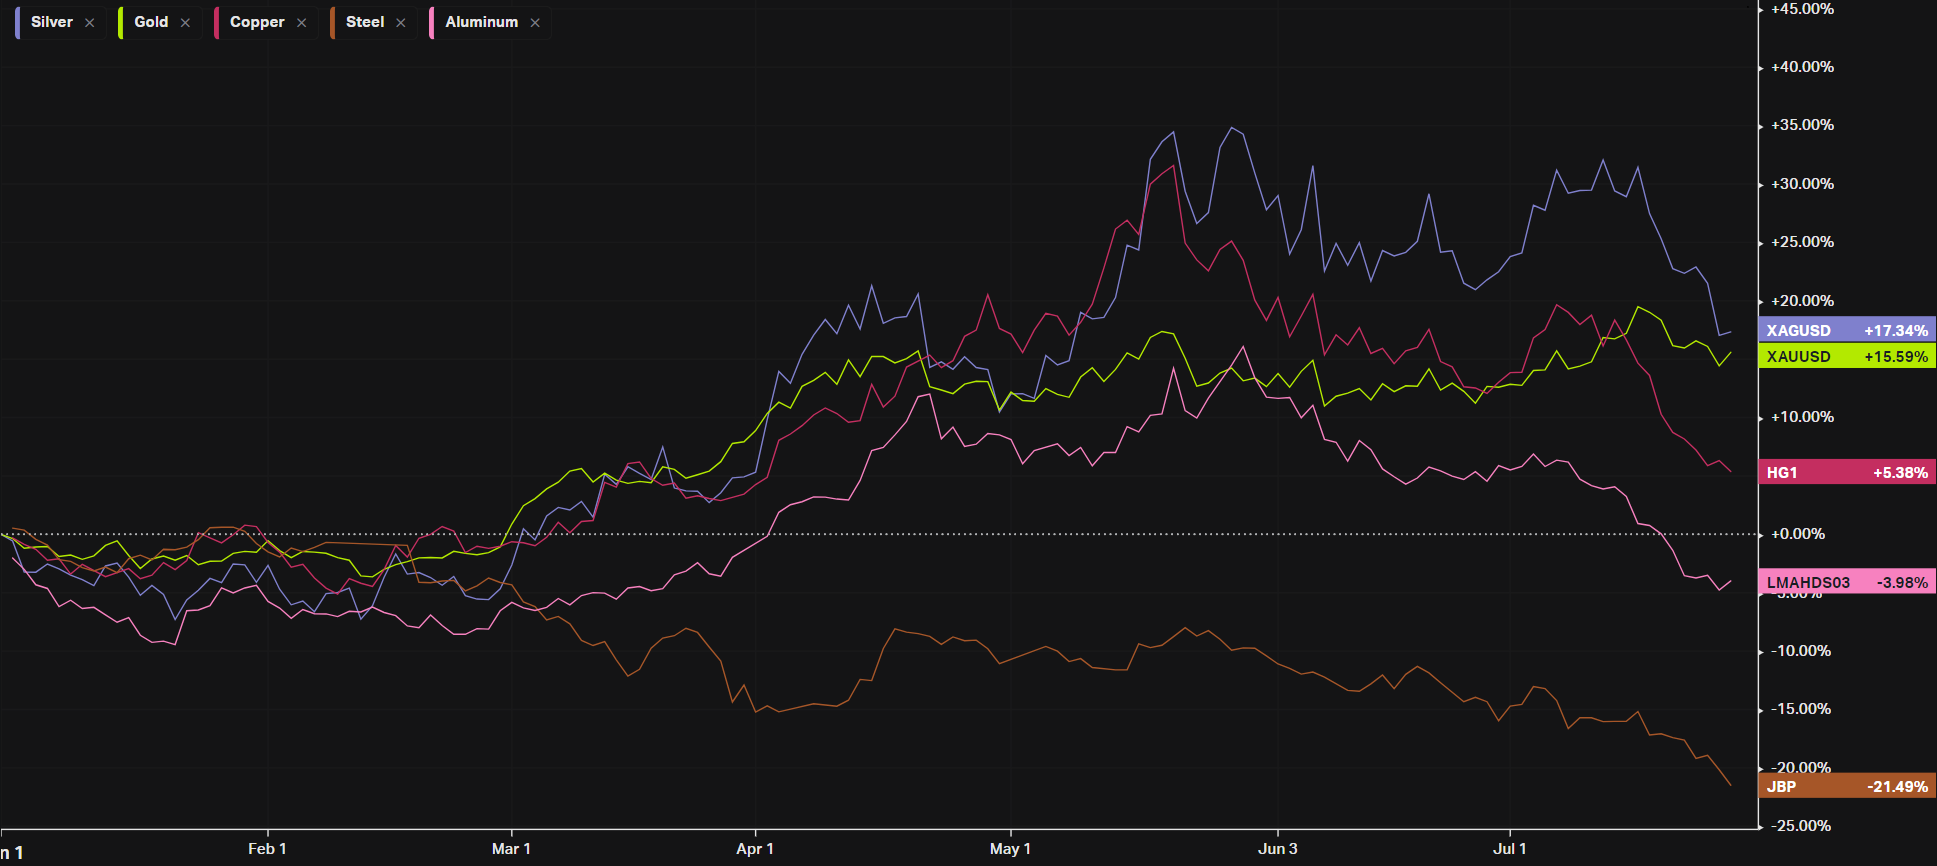
YTD Performance: Metals
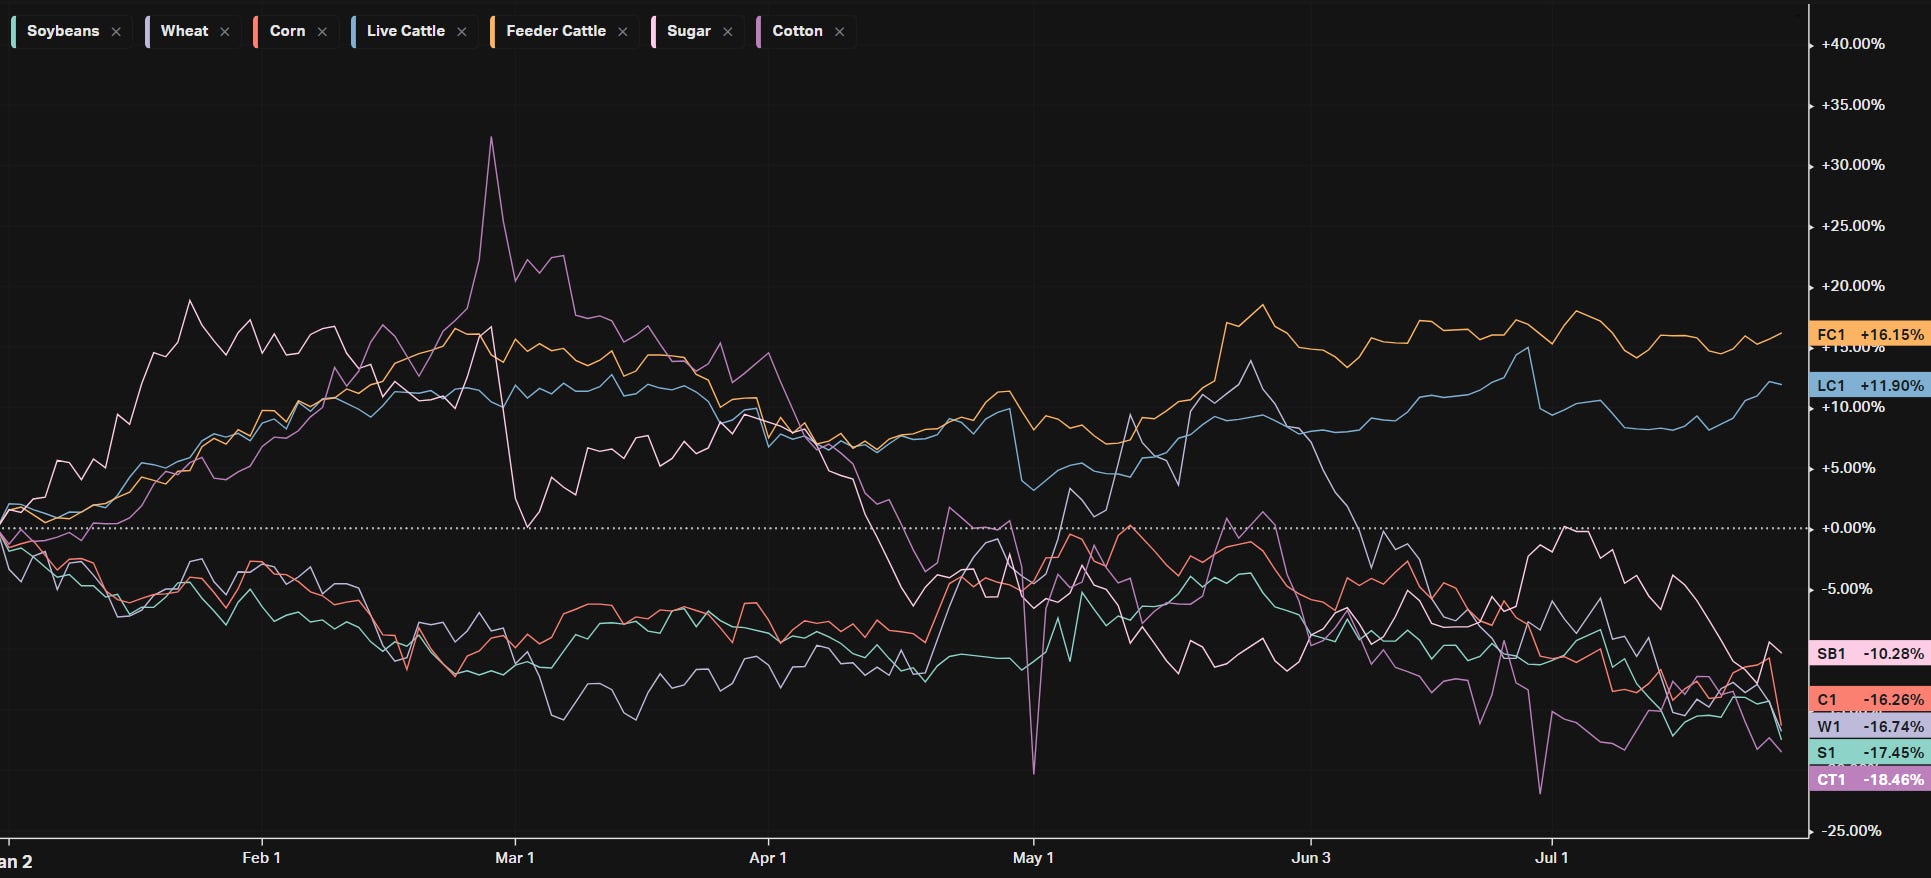
YTD Performance: Agriculture
YTD Performance: Country ETFs
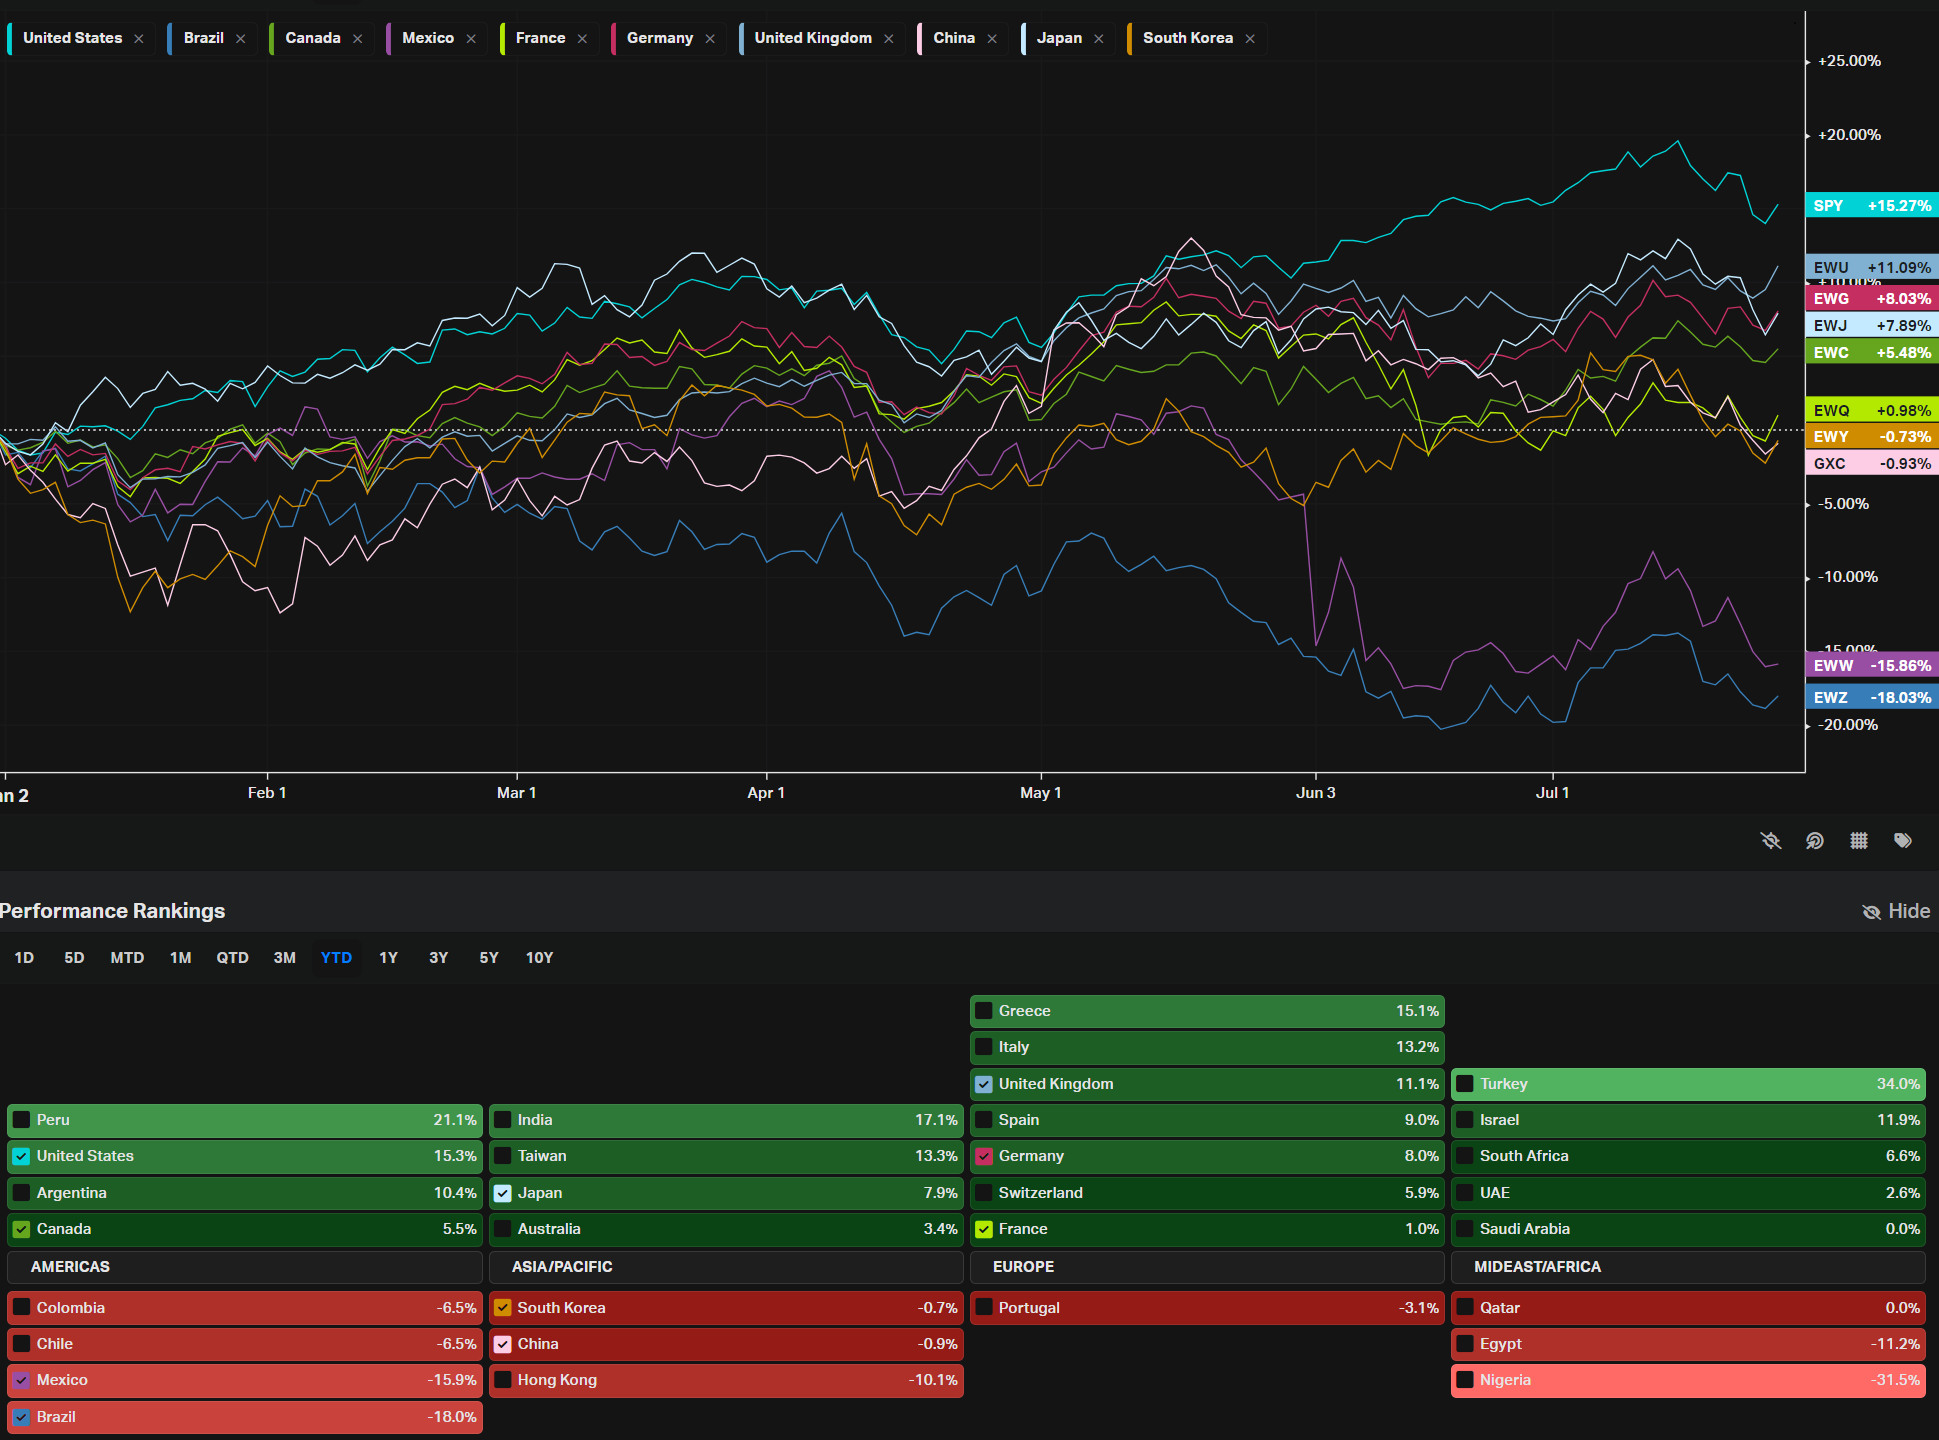
YTD Performance: Yields
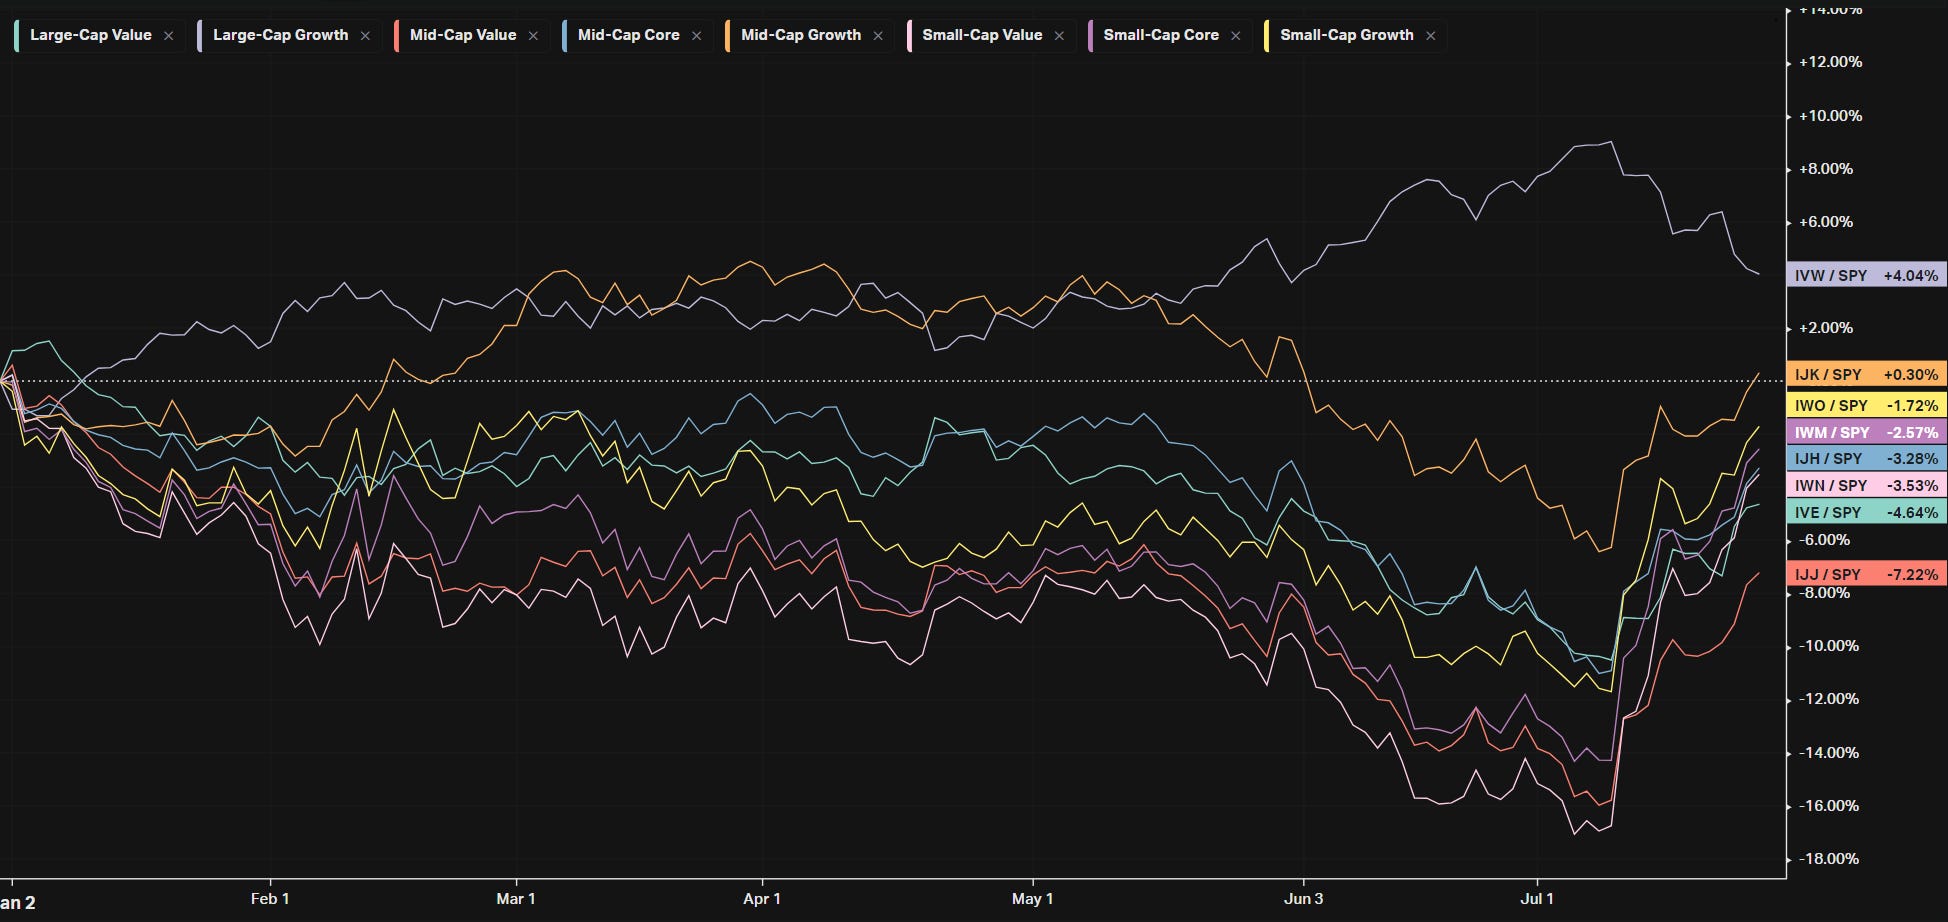
YTD Performance: Size vs Value
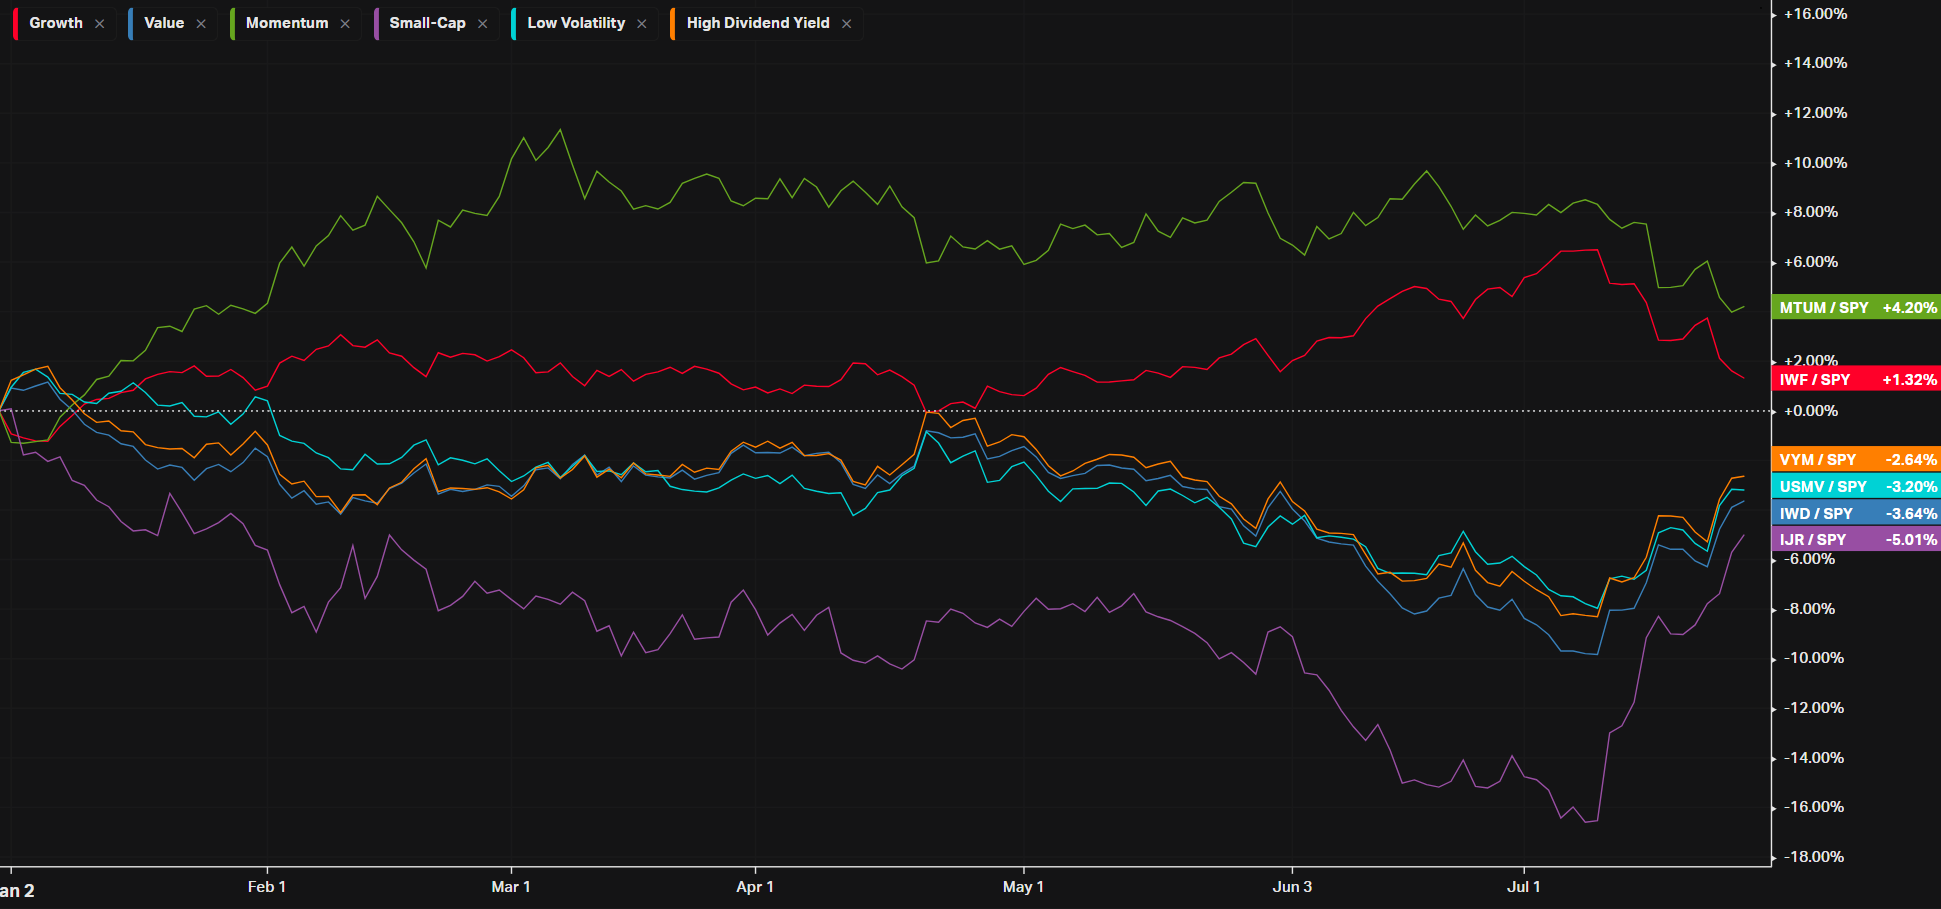
YTD Performance: Style
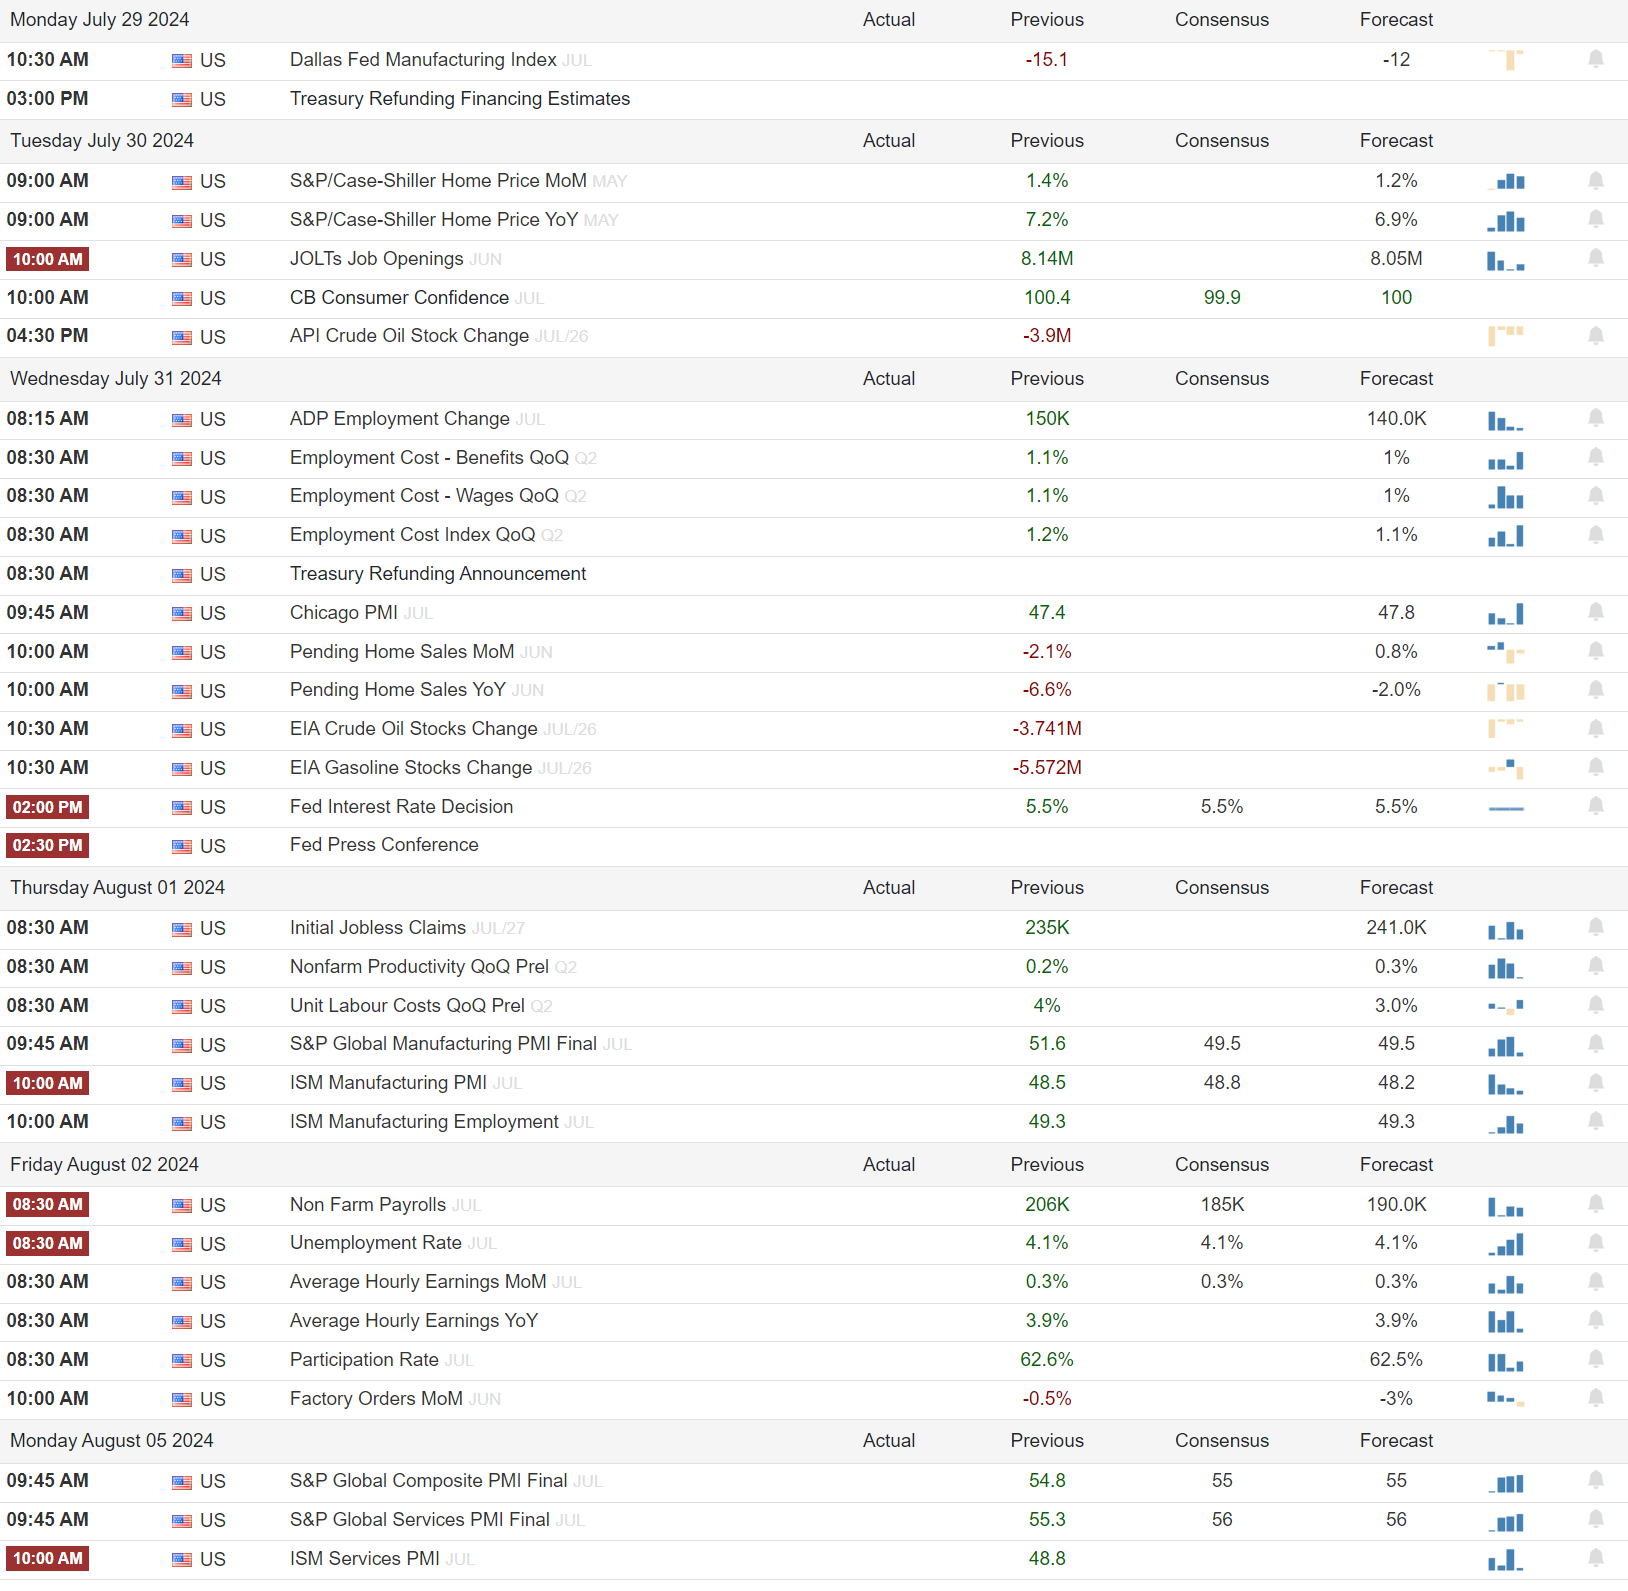
Econ Events On Deck This Week
Here are key economic events happening this week that have the potential to cause outsized moves in the market or heightened short-term volatility.
A Final Word
Thank you for reading this week's edition of Market Momentum. If you found value in this content, please consider sharing it with a friend or colleague, in a Discord or a Tweet. This small favor helps keep this stack free for you! Please checkout VolumeLeaders.com for your own free trial of the platform that brings you the data powering this stack. Wishing you all a green week ahead filled with many bags �💰.
This article is from an unpaid external contributor. It does not represent Benzinga's reporting and has not been edited for content or accuracy.
Edge Rankings
Price Trend
© 2025 Benzinga.com. Benzinga does not provide investment advice. All rights reserved.
Trade confidently with insights and alerts from analyst ratings, free reports and breaking news that affects the stocks you care about.

