Zinger Key Points
- Occidental Petroleum's stock forms death cross ahead of Q2 earnings, signaling potential bearish momentum for investors.
- Despite bearish signals, Occidental's Q2 earnings report could change outlook for stock.
- Get Wall Street's Hottest Chart Every Morning
Occidental Petroleum Corp OXY, one of Warren Buffett‘s major holdings, has just made a death cross — a bearish technical indicator — right before its second-quarter earnings report Wednesday.
As of the first quarter, Buffett’s Berkshire Hathaway Inc BRK BRK holds 248 million shares of Occidental, making it the sixth-largest holding in the portfolio, valued at over $16.1 billion. The stock represents 4.86% of the Berkshire Hathaway portfolio.
The company is set to report second-quarter earnings Wednesday after the market close, with Wall Street expecting earnings of 86 cents per share and $6.9 billion in revenue.
As investors brace for the earnings announcement, technical indicators suggest potential challenges for the stock.
Occidental’s Bearish Crossroads
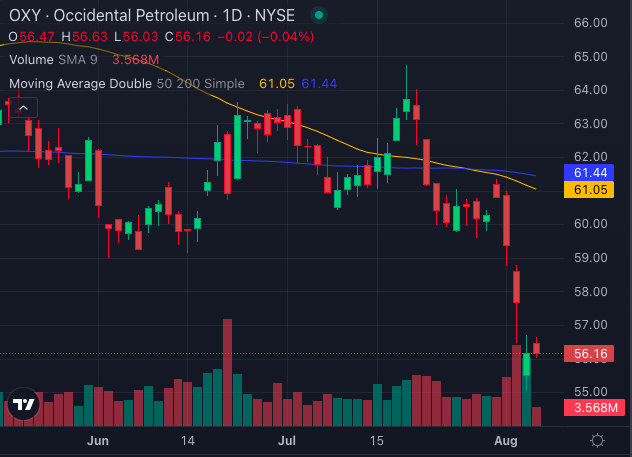
Occidental Petroleum’s stock recently formed a death cross, a classic warning signal for investors.
This occurs when a stock’s short-term moving average crosses below its long-term moving average, indicating potential downward momentum.

Chart created using Benzinga Pro
In Occidental’s case, the 50-day moving average has crossed below the 200-day moving average, suggesting a continuation of the recent decline. This pattern emerges as Occidental gears up to announce second-quarter earnings, adding another layer of complexity to the investment landscape.
Read Also: Occidental Sells Certain Delaware Basin Assets, Boosts Debt Reduction Efforts
Technical Tensions Mount
While the death cross is a significant bearish signal, other technical indicators further highlight the stock’s struggles.

Chart created using Benzinga Pro
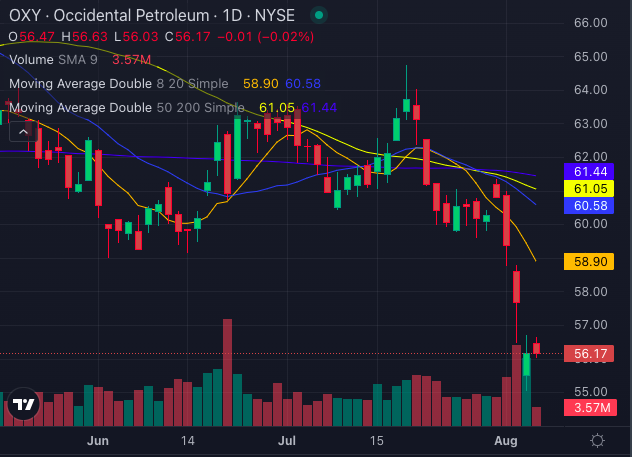
Occidental’s share price, which is trading at $56.17 at the time of writing, is trading below its eight-, 20-, 50- and 200-day simple moving averages, which underscores the strongly bearish trend.

Chart created using Benzinga Pro
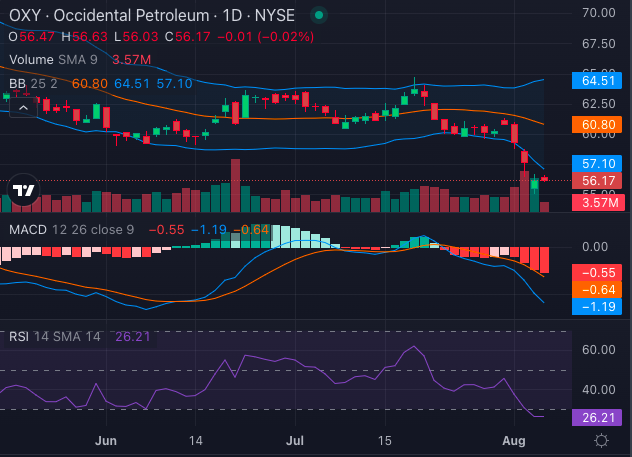
The moving average convergence divergence (MACD) indicator, at -1.19, supports this negative sentiment by suggesting sustained downward momentum.
Additionally, with an RSI of 26.21, Occidental Petroleum is in oversold territory, indicating strong selling pressure. Although this low RSI might suggest a potential short-term bounce, it also emphasizes the prevailing bearish sentiment.
Moreover, the Bollinger bands, ranging between $57.10 and $64.51, show the stock trading below this range, reinforcing the bearish sentiment.
Occidental Earnings: Turning Point For Oil Stock?
Despite the pessimistic technical outlook, Occidental Petroleum’s second-quarter earnings report could be a turning point for the stock.
If the company meets or exceeds Street expectations Wednesday, it could provide the necessary catalyst for a turnaround. And failure to meet expectations could further intensify the downward trend.
Occidental Petroleum’s stock is at a critical juncture, with technical indicators suggesting caution ahead of earnings. While the death cross and other bearish signals dominate the technical landscape, the upcoming earnings report will be crucial in determining the stock’s future trajectory.
As one of Buffett’s top holdings, Occidental’s performance in the coming days will be closely monitored by investors, eager to see if the company can overcome its challenges or continue its downward slide.
Read Next:
Photo via Shutterstock.
© 2025 Benzinga.com. Benzinga does not provide investment advice. All rights reserved.
Trade confidently with insights and alerts from analyst ratings, free reports and breaking news that affects the stocks you care about.