
In today's rapidly changing and highly competitive business world, it is imperative for investors and industry observers to carefully assess companies before making investment choices. In this article, we will undertake a comprehensive industry comparison, evaluating Costco Wholesale COST vis-à-vis its key competitors in the Consumer Staples Distribution & Retail industry. Through a detailed analysis of important financial indicators, market standing, and growth potential, our goal is to provide valuable insights and highlight company's performance in the industry.
Costco Wholesale Background
Costco operates a membership-based, no-frills retail model, predicated on offering a select product assortment in bulk quantities at bargain prices. The firm avoids maintaining costly product displays by keeping inventory on pallets and limits distribution expenses by storing its inventory at point of sale in the warehouse. Given Costco's frugal cost structure, the firm is able to price its merchandise below competing retailers, driving high sales volume per warehouse and allowing the retailer to generate strong profits on thin margins. Costco operates over 600 warehouses in the United States and enjoys over 60% market share in the domestic warehouse club industry. Internationally, Costco operates another 270 warehouses, primarily in markets such as Canada, Mexico, Japan, and the UK.
| Company | P/E | P/B | P/S | ROE | EBITDA (in billions) | Gross Profit (in billions) | Revenue Growth |
|---|---|---|---|---|---|---|---|
| Costco Wholesale Corp | 53.62 | 17.61 | 1.52 | 7.9% | $2.84 | $7.34 | 9.07% |
| Walmart Inc | 29.24 | 6.74 | 0.84 | 6.18% | $10.88 | $40.08 | 6.05% |
| Target Corp | 15.32 | 4.57 | 0.59 | 6.91% | $2.04 | $7.08 | -3.12% |
| Dollar General Corp | 17.03 | 3.67 | 0.65 | 5.28% | $0.78 | $2.99 | 6.11% |
| BJ's Wholesale Club Holdings Inc | 21.67 | 7.27 | 0.56 | 7.44% | $0.22 | $0.88 | 4.14% |
| Sendas Distribuidora SA | 21.51 | 2.96 | 0.20 | 2.58% | $1.34 | $2.95 | 11.81% |
| Pricesmart Inc | 20.31 | 2.33 | 0.53 | 2.96% | $0.07 | $0.21 | 12.11% |
| Almacenes Exito SA | 98.25 | 0.46 | 0.14 | -0.61% | $245.5 | $1321.95 | -3.32% |
| Average | 31.9 | 4.0 | 0.5 | 4.39% | $37.26 | $196.59 | 4.83% |
Upon analyzing Costco Wholesale, the following trends can be observed:
-
The current Price to Earnings ratio of 53.62 is 1.68x higher than the industry average, indicating the stock is priced at a premium level according to the market sentiment.
-
The elevated Price to Book ratio of 17.61 relative to the industry average by 4.4x suggests company might be overvalued based on its book value.
-
The Price to Sales ratio of 1.52, which is 3.04x the industry average, suggests the stock could potentially be overvalued in relation to its sales performance compared to its peers.
-
The company has a higher Return on Equity (ROE) of 7.9%, which is 3.51% above the industry average. This suggests efficient use of equity to generate profits and demonstrates profitability and growth potential.
-
Compared to its industry, the company has lower Earnings Before Interest, Taxes, Depreciation, and Amortization (EBITDA) of $2.84 Billion, which is 0.08x below the industry average, potentially indicating lower profitability or financial challenges.
-
The gross profit of $7.34 Billion is 0.04x below that of its industry, suggesting potential lower revenue after accounting for production costs.
-
The company's revenue growth of 9.07% exceeds the industry average of 4.83%, indicating strong sales performance and market outperformance.
Debt To Equity Ratio
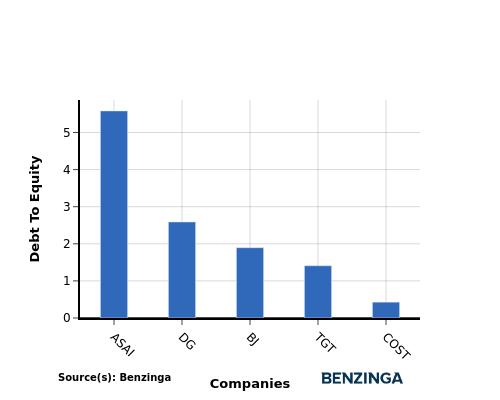
The debt-to-equity (D/E) ratio is a measure that indicates the level of debt a company has taken on relative to the value of its assets net of liabilities.
Considering the debt-to-equity ratio in industry comparisons allows for a concise evaluation of a company's financial health and risk profile, aiding in informed decision-making.
In light of the Debt-to-Equity ratio, a comparison between Costco Wholesale and its top 4 peers reveals the following information:
-
Costco Wholesale exhibits a stronger financial position compared to its top 4 peers in the sector, as indicated by its lower debt-to-equity ratio of 0.43.
-
This suggests that the company has a more favorable balance between debt and equity, which can be seen as a positive aspect for investors.
Key Takeaways
For Costco Wholesale, the PE, PB, and PS ratios are all high compared to industry peers, indicating a potentially overvalued stock. On the other hand, the high ROE and revenue growth suggest strong performance relative to competitors. However, the low EBITDA and gross profit may raise concerns about operational efficiency and profitability.
This article was generated by Benzinga's automated content engine and reviewed by an editor.
Edge Rankings
Price Trend
© 2025 Benzinga.com. Benzinga does not provide investment advice. All rights reserved.
Trade confidently with insights and alerts from analyst ratings, free reports and breaking news that affects the stocks you care about.

