Zinger Key Points
- Alibaba's strong technical signals and higher upside potential contrast with JD.com's mixed indicators and recent stock decline.
- Both Alibaba and JD.com report earnings on Aug 15, with Alibaba showing a stronger bullish trend compared to JD.
- Our government trade tracker caught Pelosi’s 169% AI winner. Discover how to track all 535 Congress member stock trades today.
As Alibaba Group Holding Ltd BABA BABAF and JD.com Inc JD gear up to report earnings Thursday, investors are eyeing which stock offers the best opportunity. Here’s a head-to-head comparison to help determine which Chinese tech giant might be the better investment.
Alibaba's Bullish Surge Vs. JD's Slump
Alibaba stock has climbed approximately 8% year-to-date, despite a 13.6% drop over the past year. The company is expected to report first-quarter earnings with an EPS estimate of $2.11 and annual revenue of $941.2 billion.
Analysts are generally bullish on Alibaba stock, with a consensus rating of Buy and price target of $118.94. Recent ratings from BofA Securities, Jefferies and Loop Capital suggest an average price target of $112.33, indicating potential upside of nearly 39%.
On the other hand, JD.com has faced a tougher year, with its stock down about 4% year-to-date and over 29% in the past year. The company is set to report second-quarter earnings with an EPS estimate of 83 cents and a quarterly revenue estimate of $40.8 billion.
JD stock’s consensus rating is also Buy, but its price target is considerably lower at $41.53. The recent average price target from Barclays, Loop Capital and Benchmark suggests a 60.55% upside.
Read Also: Alibaba’s Lazada Hits Monthly Profit, Eyes Expansion in Southeast Asia: Report
Technical Playbook: Alibaba's Bullish Signal Vs. JD's Mixed Message
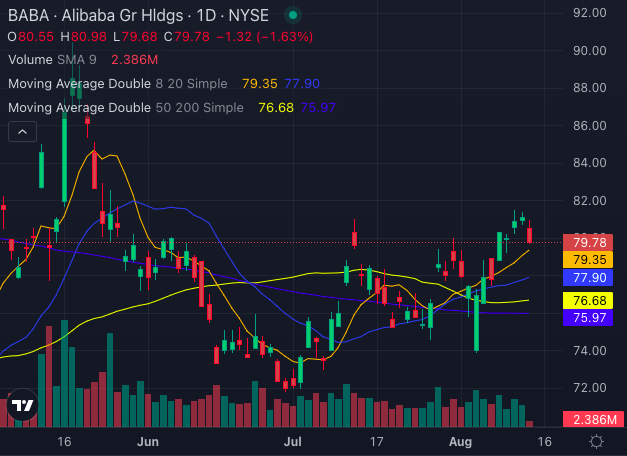
Technically, Alibaba shows a strong bullish trend.

Chart created using Benzinga Pro
Alibaba stock is trading above its five, 20 and 50-day exponential moving averages, signaling buying pressure. Its current price is above the eight, 20, 50 and 200-day simple moving averages, reinforcing a bulling signal.

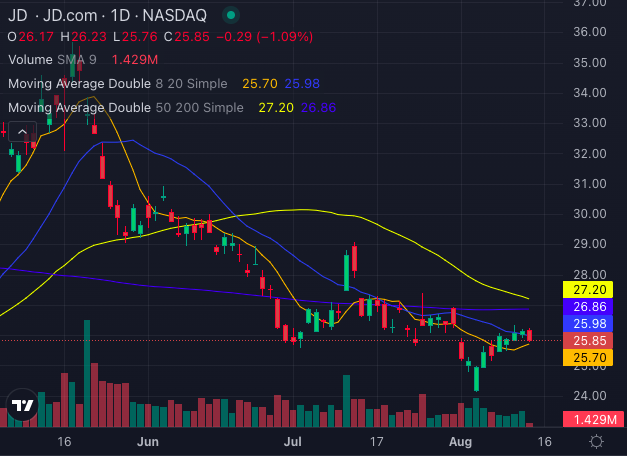
Chart created using Benzinga Pro
Conversely, JD.com stock’s technical indicators paint a mixed picture. While the eight-day simple moving average suggests a bullish signal, the 20, 50 and 200-day simple moving averages point toward a bearish signal. This indicates potential caution despite some positive buying pressure.
Alibaba appears to be in a stronger technical position with higher potential upside based on recent analyst ratings and technical indicators.
JD.com, though offering a higher upside percentage, has faced a more challenging market and mixed technical signals.
Investors will need to weigh these factors carefully as both companies prepare to unveil their latest earnings results.
Read Next:
© 2025 Benzinga.com. Benzinga does not provide investment advice. All rights reserved.
Trade confidently with insights and alerts from analyst ratings, free reports and breaking news that affects the stocks you care about.