By Lance Roberts
We are currently in the “everything market.” It doesn’t matter what you have probably invested in; it is currently increasing in value. However, it isn’t likely for the reasons you think. A recent Marketwatch interview with the always bullish Jim Paulson got his reasoning for the rally.
“It is this cocktail of ‘full support’ at the front end of a bull market which commonly has created an ‘Everything Market’ during the early part of a new bull. That is, for a period, almost everything simultaneously rises – value, growth, small, large, defensive, and cyclical stocks – and usually by a lot.
Short rates are falling, bond yields have declined, money growth is rising, fiscal stimulus has again expanded, and disinflation is still evident; and because of this new and overwhelming support, expectations for a soft landing should grow while both consumer and business confidence improves.” – Jim Paulson
But that isn’t the reason.
On the other side of the bull/bear argument are “gold bugs” enjoying soaring gold prices because “debts and deficits” are finally eroding the U.S. economy. As Michael Hartnet of BofA recently stated:
“Long-run returns in commodities are rising after the worst decade since the 1930s, led by gold, which is a hedge against the 3Ds: debt, deficit, debasement.”
The evidence doesn’t support that view. Historically, when deficits as a percentage of GDP increase, gold does very well as concerns about U.S. economic health increase (as per Michael Hartnett of BofA.) However, gold performs poorly as economic growth resumes and the deficit declines. Such is logical, except that since 2020, gold has soared in price even as economic health remains robust and the deficit as a percentage of GDP continues to decline.
While stocks and gold have risen this year, bonds, commodities, real estate, and cryptocurrencies have also enjoyed gains.
In other words, whatever your “thesis” is for whatever asset you own, the price action currently supports that thesis. That does not mean your thesis is correct.
In an “everything rally,” rising asset prices cover investing mistakes.
Therefore, this analysis should elicit two important questions: 1) what drives the “everything rally,” and 2) when will it end?
Whatever Your Thesis Is – It’s Probably Wrong
When it comes to what is driving the “everything rally,” everyone has their thesis. The “stock jockeys” suggest that easier monetary accommodation by the Fed and improving earnings are the key drivers for equities. As noted above, the “gold bugs” are seduced by burgeoning government spending and expectations of a dollar decline to loft gold prices higher. Every asset class has its “reason” for going higher, but the real reason may be much simpler. This post will focus on stocks and gold as they garner the most headlines and have the most fervent of “true believers.”
In every market and asset class, the price is determined by supply and demand. If there are more buyers than sellers, then prices rise, and vice-versa. While economic, geopolitical, or financial data points may temporarily affect and shift the balance between those wanting to buy or sell, in the end, the price is solely determined by asset flows.
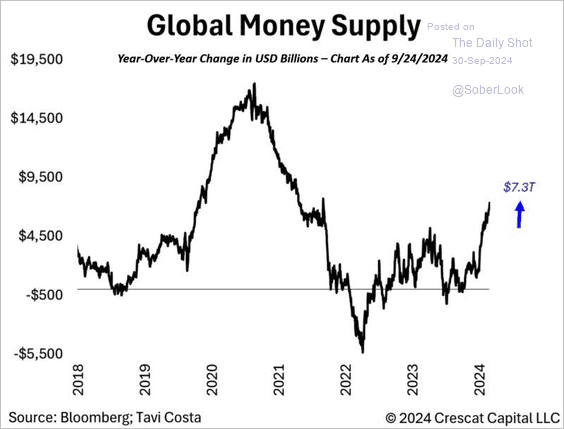
Notably, the amount of money flowing into assets has been remarkable since 2014. Despite many “concerns,” 2024 is on track to be the second-strongest year of monetary inflows since 2021. That statistic is amazing when considering the government was flooding the system with trillions in monetary and fiscal stimulus then versus contracting it currently.
Unsurprisingly, as asset prices increase during the “everything market,” more money is pulled into those assets, forcing prices to rise as demand outstrips supply. As we noted previously, for “every buyer, there is a seller…at a specific price.” That “demand” for stocks, gold, real estate, cryptocurrencies, etc., comes from many sources.
- Hedge funds
- Private equity funds
- Corporate share buyback programs
- Passive indexes
- Pension funds
- Institutional funds
- Mutual Funds
- Retirement plans
- Global investors
- Retail investors
Most important is the supply of capital from Central Banks.
Of course, a massive accumulation of cash in money market funds will face declining yields as the Federal Reserve cuts interest rates.
As noted, whatever your “thesis” for owning an asset probably isn’t the actual reason. There are three primary reasons why asset prices are rising in the “everything market.”
- Liquidity
- Liquidity
- Liquidity
In other words, in an “everything market,” there is too much money chasing too few assets.
As noted, “money flows” are the “demand side” of the equation. As previously discussed, the “supply side,” or the amount of “assets available,” continues to decline. Such explains why managers continue to “chase stocks” despite high valuations.
“The number of publicly traded companies continues to decline, as shown in the following chart from Apollo. This decline has many reasons, including mergers and acquisitions, bankruptcy, leveraged buyouts, and private equity. For example, Twitter (now X) was once a publicly traded company before Elon Musk acquired it and took it private. Unsurprisingly, with fewer publicly traded companies, there are fewer opportunities as market capital increases. Such is particularly the case for large institutions that must deploy large amounts of capital over short periods.”
The same is true for gold. While the demand for gold increases as prices rise, the supply of gold has declined since 2019.
As such, gold is no longer a “risk-off ” asset with a negative correlation to equities but is now a risk-on asset, just like equities. The 4-year correlation to the S&P 500 is near previous peaks, with subsequent performance.
Of course, these “everything markets” can last much longer than logic suggests. However, they do end. What causes “everything markets” to end is whatever exogenous, unexpected event turns off the flow of liquidity.
Technically Speaking
As noted, “everything markets” can last longer than logic dictates. However, they eventually end, and we don’t know what will cause it or when. Take a look at the two charts below.
In each chart, I have denoted periods where three factors occurred:
- The market traded at 2-or more standard deviations above the 4-year moving average
- Relative Strength was overbought on a long-term basis
- The MACD was elevated and triggering a “sell signal.”
In both cases, these technical extremes marked short to long-term corrections and consolidations for stocks and gold. For the S&P 500 index, these periods also corresponded to more important headline events such as the “Crash of 1987,” the “Dot.com Crash,” and the “Financial Crisis.” Notably, like the S&P 500, the technical deviations for gold are also at levels that have denoted short to long-term corrective cycles.
As Paulsen noted in his interview, “everything markets” typically last only six months to a year. He expects this one to be in force at least for “the next several months.”
“Although the road ahead, even if some of my thinking proves correct, will still be interrupted by regular bouts of volatility, investors may want to consider staying bullish during the next several months, finally enjoying a mini restart to this bull market and perhaps witness what full support can do for your portfolio.”
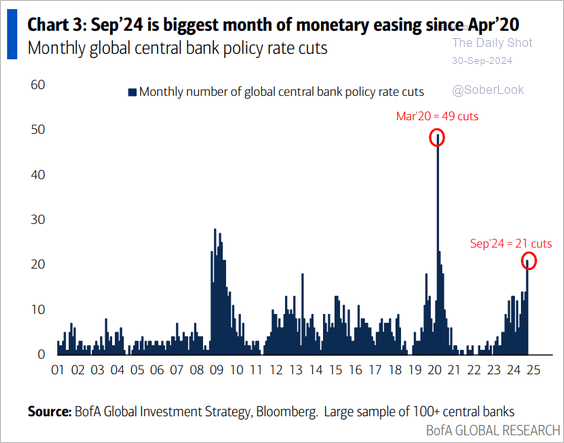
We have no idea what will eventually cause a shift in liquidity as the Federal Reserve and global central banks move back into easing mode. (The monetary conditions index combines interest rates, the dollar, and inflation. It is inverted to correspond to rising asset prices.)
Critically, September was the biggest month of monetary easing since April 2020 amid the global pandemic crisis.
Notably, an eventual reversal could be caused by a “crisis event” or a reversal of monetary flows. The technical analysis tells us that it will occur and likely when the fewest investors expect it.
But that isn’t today.
Of course, this is always the case, so investors regularly “buy high and sell low.”
Remember Warren Buffett’s famous words when investing in an “everything market.”
“Investing is a lot like sex. It feels the best just before the end.”
Of course, maybe that is why Warren has been raising a lot of cash lately.
That’s it for today! If you want more insights like these, subscribe to our newsletter for regular updates on market trends and investing strategies.
Lance Roberts is a Chief Portfolio Strategist/Economist for RIA Advisors. He is also the host of “The Lance Roberts Podcast” and Chief Editor of the “Real Investment Advice” website and author of “Real Investment Daily” blog and “Real Investment Report“. Follow Lance on Facebook, Twitter, Linked-In and YouTube
© 2025 Benzinga.com. Benzinga does not provide investment advice. All rights reserved.
Trade confidently with insights and alerts from analyst ratings, free reports and breaking news that affects the stocks you care about.


