Zinger Key Points
- Meta’s Q3 earnings on Wednesday are expected to deliver $5.24 EPS and $40.27 billion in revenue.
- Trading well above key SMAs, Meta stock signals bullish momentum, with analysts projecting 14% upside.
- In a market dominated by tariff tensions, geopolitical surprises, and Fed uncertainty, Matt Maley's technical approach delivers clear entry & exit points for consistent income potential. Try it free for 7 days
Meta Platforms Inc META will report third-quarter earnings on Wednesday, Oct. 30. Wall Street expects $5.24 in EPS and $40.27 billion in revenues as the company reports after market hours.
Meta stock is up 94.9% over the past year, 70.35% year-to-date.
Let’s look at what the charts indicate for Meta stock and how the stock currently maps against Wall Street estimates.
Read Also: Retail Investors Betting Money On A Trump Win, Meta To Challenge Google Search Dominance
Meta Stock Chart Bullish Ahead Of Q3 Earnings
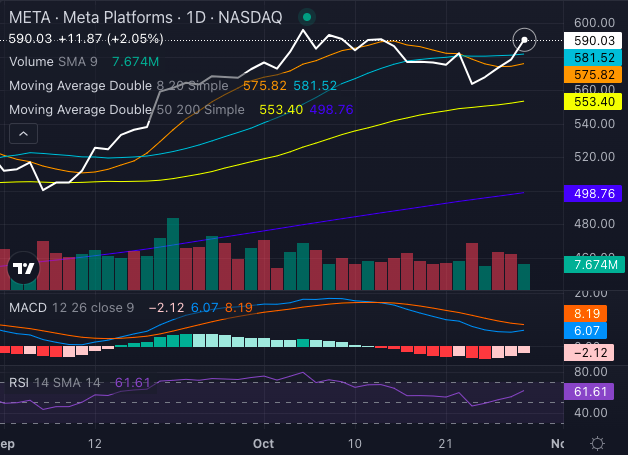
Meta stock displays a primarily bullish technical outlook, suggesting potential gains for investors despite minor short-term challenges.

Chart created using Benzinga Pro
Trading above its five, 50 and 200-day exponential moving averages, Meta's price of $590.03 points to solid buying interest and an overall bullish trend.
The share price remains above the eight-day simple moving average (SMA) at $575.82, the 20-day SMA at $581.52, hinting at solid short-term momentum.
Moreover, the stock's strength above the 50-day SMA of $553.40 and well above the 200-day SMA of $498.76 signals positive momentum, especially for long-term investors.
The MACD at 6.07 supports this bullish stance, and with the rising RSI at 61.61 hovering near overbought levels, investors should monitor for any near-term pullbacks as possible buying opportunities within an overall upward trend.
Meta Analysts See Over 14% Upside
Ratings & Consensus Estimates: The consensus analyst rating on Meta stock stands at a Buy currently with a price target of $620.05. The latest analyst ratings from Bernstein, Jefferies and TD Cowen in October, suggest a 14.32% upside for Meta stock, with an average price target of $675.
Price Action: Meta stock was trading at $590.32 at the time of publication.
Read Next:
Image: Unsplash
Edge Rankings
Price Trend
© 2025 Benzinga.com. Benzinga does not provide investment advice. All rights reserved.
Trade confidently with insights and alerts from analyst ratings, free reports and breaking news that affects the stocks you care about.