
Providing a diverse range of perspectives from bullish to bearish, 4 analysts have published ratings on i3 Verticals IIIV in the last three months.
The table below provides a concise overview of recent ratings by analysts, offering insights into the changing sentiments over the past 30 days and drawing comparisons with the preceding months for a holistic perspective.
| Bullish | Somewhat Bullish | Indifferent | Somewhat Bearish | Bearish | |
|---|---|---|---|---|---|
| Total Ratings | 2 | 2 | 0 | 0 | 0 |
| Last 30D | 0 | 1 | 0 | 0 | 0 |
| 1M Ago | 0 | 0 | 0 | 0 | 0 |
| 2M Ago | 0 | 0 | 0 | 0 | 0 |
| 3M Ago | 2 | 1 | 0 | 0 | 0 |
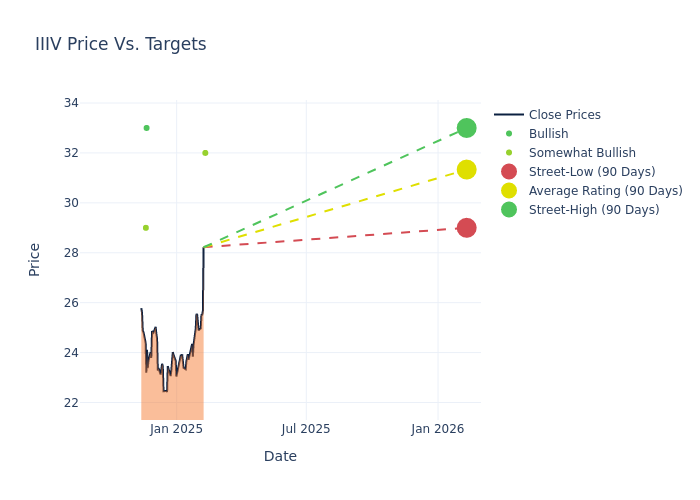
The 12-month price targets, analyzed by analysts, offer insights with an average target of $31.75, a high estimate of $33.00, and a low estimate of $29.00. This upward trend is evident, with the current average reflecting a 4.1% increase from the previous average price target of $30.50.
Diving into Analyst Ratings: An In-Depth Exploration
An in-depth analysis of recent analyst actions unveils how financial experts perceive i3 Verticals. The following summary outlines key analysts, their recent evaluations, and adjustments to ratings and price targets.
| Analyst | Analyst Firm | Action Taken | Rating | Current Price Target | Prior Price Target |
|---|---|---|---|---|---|
| Alex Markgraff | Keybanc | Raises | Overweight | $32.00 | $27.00 |
| Mark Palmer | Benchmark | Maintains | Buy | $33.00 | $33.00 |
| Charles Nabhan | Stephens & Co. | Maintains | Overweight | $29.00 | $29.00 |
| Mark Palmer | Benchmark | Maintains | Buy | $33.00 | $33.00 |
Key Insights:
- Action Taken: Analysts frequently update their recommendations based on evolving market conditions and company performance. Whether they 'Maintain', 'Raise' or 'Lower' their stance, it reflects their reaction to recent developments related to i3 Verticals. This information provides a snapshot of how analysts perceive the current state of the company.
- Rating: Unveiling insights, analysts deliver qualitative insights into stock performance, from 'Outperform' to 'Underperform'. These ratings convey expectations for the relative performance of i3 Verticals compared to the broader market.
- Price Targets: Analysts predict movements in price targets, offering estimates for i3 Verticals's future value. Examining the current and prior targets offers insights into analysts' evolving expectations.
For valuable insights into i3 Verticals's market performance, consider these analyst evaluations alongside crucial financial indicators. Stay well-informed and make prudent decisions using our Ratings Table.
Stay up to date on i3 Verticals analyst ratings.
If you are interested in following small-cap stock news and performance you can start by tracking it here.
Discovering i3 Verticals: A Closer Look
i3 Verticals Inc offers integrated payment and software solutions to small and medium-sized businesses and organizations in strategic vertical markets. Its operating segment includes Public Sector and Healthcare. The company generates maximum revenue from the Public Sector segment.
Unraveling the Financial Story of i3 Verticals
Market Capitalization Analysis: Reflecting a smaller scale, the company's market capitalization is positioned below industry averages. This could be attributed to factors such as growth expectations or operational capacity.
Positive Revenue Trend: Examining i3 Verticals's financials over 3 months reveals a positive narrative. The company achieved a noteworthy revenue growth rate of 3.89% as of 30 September, 2024, showcasing a substantial increase in top-line earnings. As compared to competitors, the company encountered difficulties, with a growth rate lower than the average among peers in the Information Technology sector.
Net Margin: i3 Verticals's net margin is impressive, surpassing industry averages. With a net margin of 193.73%, the company demonstrates strong profitability and effective cost management.
Return on Equity (ROE): i3 Verticals's financial strength is reflected in its exceptional ROE, which exceeds industry averages. With a remarkable ROE of 37.47%, the company showcases efficient use of equity capital and strong financial health.
Return on Assets (ROA): i3 Verticals's financial strength is reflected in its exceptional ROA, which exceeds industry averages. With a remarkable ROA of 14.81%, the company showcases efficient use of assets and strong financial health.
Debt Management: i3 Verticals's debt-to-equity ratio is below the industry average at 0.09, reflecting a lower dependency on debt financing and a more conservative financial approach.
The Core of Analyst Ratings: What Every Investor Should Know
Within the domain of banking and financial systems, analysts specialize in reporting for specific stocks or defined sectors. Their work involves attending company conference calls and meetings, researching company financial statements, and communicating with insiders to publish "analyst ratings" for stocks. Analysts typically assess and rate each stock once per quarter.
Analysts may enhance their evaluations by incorporating forecasts for metrics like growth estimates, earnings, and revenue, delivering additional guidance to investors. It is vital to acknowledge that, although experts in stocks and sectors, analysts are human and express their opinions when providing insights.
Which Stocks Are Analysts Recommending Now?
Benzinga Edge gives you instant access to all major analyst upgrades, downgrades, and price targets. Sort by accuracy, upside potential, and more. Click here to stay ahead of the market.
This article was generated by Benzinga's automated content engine and reviewed by an editor.
© 2025 Benzinga.com. Benzinga does not provide investment advice. All rights reserved.
date | ticker | name | Price Target | Upside/Downside | Recommendation | Firm |
|---|
Trade confidently with insights and alerts from analyst ratings, free reports and breaking news that affects the stocks you care about.

