


Zinger Key Points
- The chart of Fidelity National Information Services (FIS) teaches two valuable lessons.
- Seller's remorse can turn resistance into support and keep support intact.
- Don't face extreme market conditions unprepared. Get the professional edge with Benzinga Pro's exclusive alerts, news advantage, and volatility tools at 60% off today.
Shares of Fidelity National Information Services, Inc. FIS are quiet Wednesday. This follows yesterday’s sell-off of 11.5%. The shares closed around the $73 level.
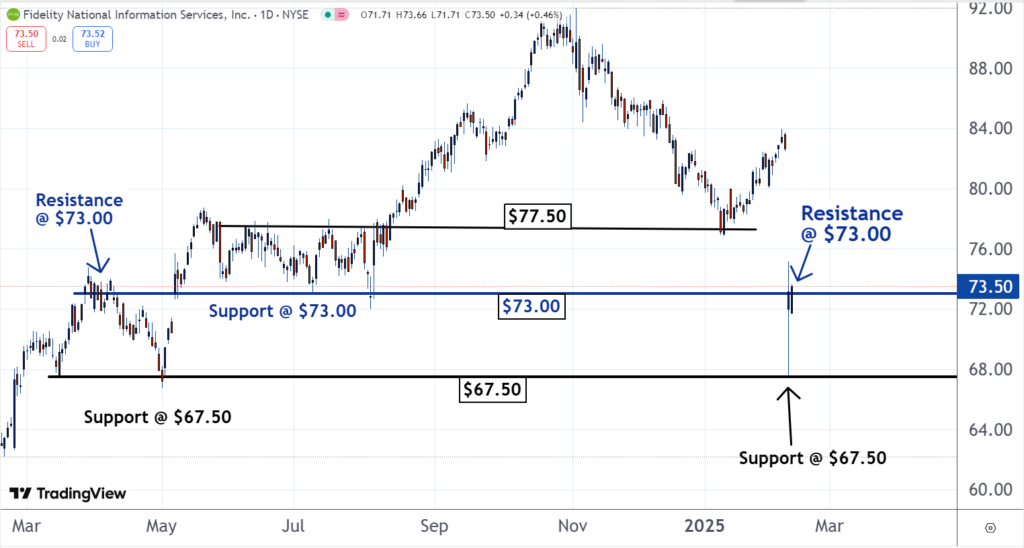
In financial markets, some price levels are more important for stocks than others and this is the case with the $73 level for Fidelity National. This is why it is our Stock of the Day.
This level was resistance for the stock in March and April 2024. There was a large amount of sell interest at this level. Every time the stock rallied to it, the sellers overpowered the buyers and pushed the shares lower.
But in May 2024, the buyers finally took out the resistance and the price moved higher. When this happened, many who sold regretted their decision to do so and decided to buy their shares back if they could at the same price they were sold for.
So, when the stock returned to this level in June 2024, they placed buy orders. And there were so many of these orders, that it created support.
Read Also: New Treasury ETFs Target Liquidity As Vanguard Expands Fixed-Income Lineup
Seller's remorse can turn price levels that had been resistance into support. This happens if there are enough remorseful sellers placing buy orders at the price that had previously been resistance.
The same type of price action occurred at the $77.50 level. It was resistance from June 2024 through August 2024. Then it converted into a support level in January 2025.
Seller's remorse can also keep support levels intact for an extended period of time.
The $67.50 level was support in March 2024. Then it became support again in May 2024.
This happened because a number of the traders and investors who sold in March came to regret doing so when the price rallied soon after. Some decided that if they can buy their shares back at the same price they were sold for, they would.
When the stock returned to this level in May, they placed buy orders. And there were so many that it created support at the same price that had been support before.
As you can see on the chart below, yesterday's massive selloff came to an end when Fidelity National reached levels around $67.50. This wasn't a coincidence. It's an example of a stock finding support at a price level that had been support in the past.
The best traders know that some price levels are more important than others. This allowed them to profit on yesterday's selloff because they could sense where the stock would find a bottom. If a stock is in decline, there is a good chance it will at a price that had previously been support or resistance.
Read Next:
Image: Shutterstock
Edge Rankings
Price Trend
© 2025 Benzinga.com. Benzinga does not provide investment advice. All rights reserved.
Trade confidently with insights and alerts from analyst ratings, free reports and breaking news that affects the stocks you care about.

