
Analysts' ratings for Lululemon Athletica LULU over the last quarter vary from bullish to bearish, as provided by 14 analysts.
The following table encapsulates their recent ratings, offering a glimpse into the evolving sentiments over the past 30 days and comparing them to the preceding months.
| Bullish | Somewhat Bullish | Indifferent | Somewhat Bearish | Bearish | |
|---|---|---|---|---|---|
| Total Ratings | 3 | 9 | 2 | 0 | 0 |
| Last 30D | 0 | 1 | 0 | 0 | 0 |
| 1M Ago | 0 | 0 | 0 | 0 | 0 |
| 2M Ago | 0 | 3 | 0 | 0 | 0 |
| 3M Ago | 3 | 5 | 2 | 0 | 0 |
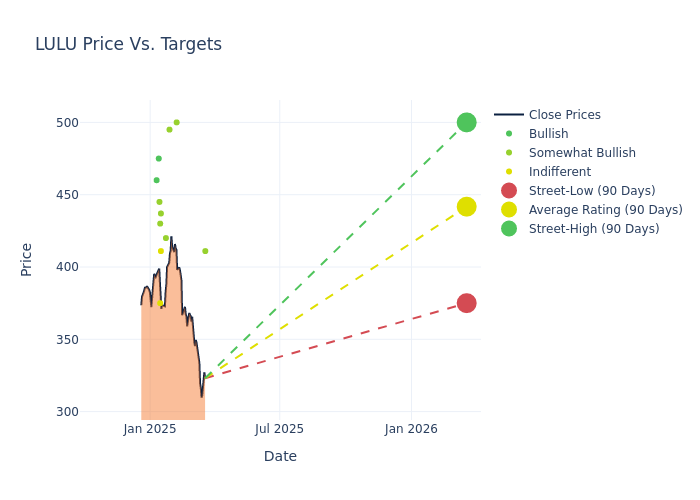
The 12-month price targets, analyzed by analysts, offer insights with an average target of $441.57, a high estimate of $500.00, and a low estimate of $375.00. Observing a 7.1% increase, the current average has risen from the previous average price target of $412.31.
Investigating Analyst Ratings: An Elaborate Study
The standing of Lululemon Athletica among financial experts becomes clear with a thorough analysis of recent analyst actions. The summary below outlines key analysts, their recent evaluations, and adjustments to ratings and price targets.
| Analyst | Analyst Firm | Action Taken | Rating | Current Price Target | Prior Price Target |
|---|---|---|---|---|---|
| Alexandra Steiger | Morgan Stanley | Lowers | Overweight | $411.00 | $420.00 |
| Brian Nagel | Oppenheimer | Raises | Outperform | $500.00 | $380.00 |
| Michael Binetti | Evercore ISI Group | Raises | Outperform | $495.00 | $440.00 |
| Paul Knight | Keybanc | Raises | Overweight | $420.00 | $400.00 |
| Adrienne Yih | Barclays | Raises | Equal-Weight | $411.00 | $378.00 |
| Matthew Boss | JP Morgan | Raises | Overweight | $437.00 | $428.00 |
| Alexandra Steiger | Morgan Stanley | Raises | Overweight | $420.00 | $414.00 |
| Rick Patel | Raymond James | Raises | Outperform | $430.00 | $400.00 |
| Ike Boruchow | Wells Fargo | Raises | Equal-Weight | $375.00 | $350.00 |
| Dana Telsey | Telsey Advisory Group | Raises | Outperform | $445.00 | $430.00 |
| Tom Nikic | Needham | Maintains | Buy | $475.00 | $475.00 |
| Joseph Civello | Truist Securities | Raises | Buy | $460.00 | $420.00 |
| Tom Nikic | Needham | Announces | Buy | $475.00 | - |
| Matthew Boss | JP Morgan | Raises | Overweight | $428.00 | $425.00 |
Key Insights:
- Action Taken: In response to dynamic market conditions and company performance, analysts update their recommendations. Whether they 'Maintain', 'Raise', or 'Lower' their stance, it signifies their reaction to recent developments related to Lululemon Athletica. This insight gives a snapshot of analysts' perspectives on the current state of the company.
- Rating: Delving into assessments, analysts assign qualitative values, from 'Outperform' to 'Underperform'. These ratings communicate expectations for the relative performance of Lululemon Athletica compared to the broader market.
- Price Targets: Gaining insights, analysts provide estimates for the future value of Lululemon Athletica's stock. This comparison reveals trends in analysts' expectations over time.
Navigating through these analyst evaluations alongside other financial indicators can contribute to a holistic understanding of Lululemon Athletica's market standing. Stay informed and make data-driven decisions with our Ratings Table.
Stay up to date on Lululemon Athletica analyst ratings.
Delving into Lululemon Athletica's Background
Lululemon Athletica designs, distributes, and markets athletic apparel, footwear, and accessories for women, men, and girls. Lululemon offers pants, shorts, tops, and jackets for both leisure and athletic activities such as yoga and running. The company also sells fitness accessories, such as bags, yoga mats, and equipment. Lululemon sells its products through more than 700 company-owned stores in about 20 countries, e-commerce, outlets, and wholesale accounts. The company was founded in 1998 and is based in Vancouver, Canada.
Understanding the Numbers: Lululemon Athletica's Finances
Market Capitalization Analysis: With an elevated market capitalization, the company stands out above industry averages, showcasing substantial size and market acknowledgment.
Revenue Growth: Over the 3 months period, Lululemon Athletica showcased positive performance, achieving a revenue growth rate of 8.73% as of 31 October, 2024. This reflects a substantial increase in the company's top-line earnings. In comparison to its industry peers, the company stands out with a growth rate higher than the average among peers in the Consumer Discretionary sector.
Net Margin: Lululemon Athletica's net margin excels beyond industry benchmarks, reaching 14.68%. This signifies efficient cost management and strong financial health.
Return on Equity (ROE): Lululemon Athletica's ROE excels beyond industry benchmarks, reaching 8.78%. This signifies robust financial management and efficient use of shareholder equity capital.
Return on Assets (ROA): Lululemon Athletica's ROA surpasses industry standards, highlighting the company's exceptional financial performance. With an impressive 5.09% ROA, the company effectively utilizes its assets for optimal returns.
Debt Management: The company maintains a balanced debt approach with a debt-to-equity ratio below industry norms, standing at 0.38.
The Significance of Analyst Ratings Explained
Analyst ratings serve as essential indicators of stock performance, provided by experts in banking and financial systems. These specialists diligently analyze company financial statements, participate in conference calls, and engage with insiders to generate quarterly ratings for individual stocks.
Analysts may supplement their ratings with predictions for metrics like growth estimates, earnings, and revenue, offering investors a more comprehensive outlook. However, investors should be mindful that analysts, like any human, can have subjective perspectives influencing their forecasts.
Which Stocks Are Analysts Recommending Now?
Benzinga Edge gives you instant access to all major analyst upgrades, downgrades, and price targets. Sort by accuracy, upside potential, and more. Click here to stay ahead of the market.
This article was generated by Benzinga's automated content engine and reviewed by an editor.
Edge Rankings
Price Trend
© 2025 Benzinga.com. Benzinga does not provide investment advice. All rights reserved.
date | ticker | name | Price Target | Upside/Downside | Recommendation | Firm |
|---|
Trade confidently with insights and alerts from analyst ratings, free reports and breaking news that affects the stocks you care about.

